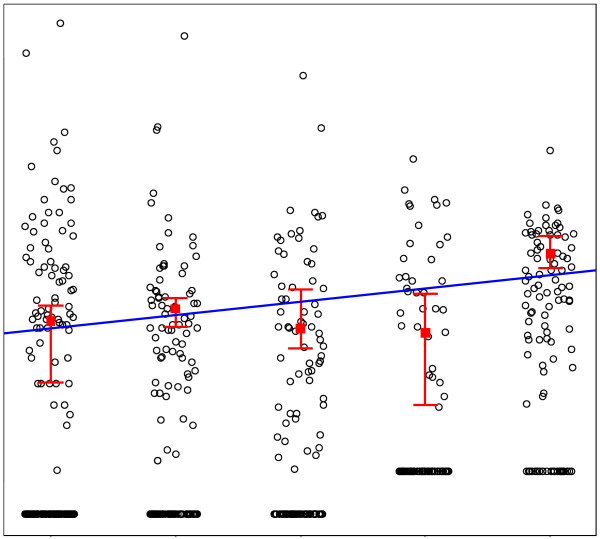
Figure 3.
The five observation time points of IL-10. Legend: The data points have been "jittered" (a random horizontal shift between −0.2 and 0.2) for better visibility. For each time point the midpoint (coefficient) for the P75 with 95% confidence interval are shown. The intervals are not symmetric around the midpoint. The line represents the P75 quantile regression line for the logarithm of the concentration.T0, baseline. T1-2-3-4, follow-up after 6-12-18-24 months respectively.

