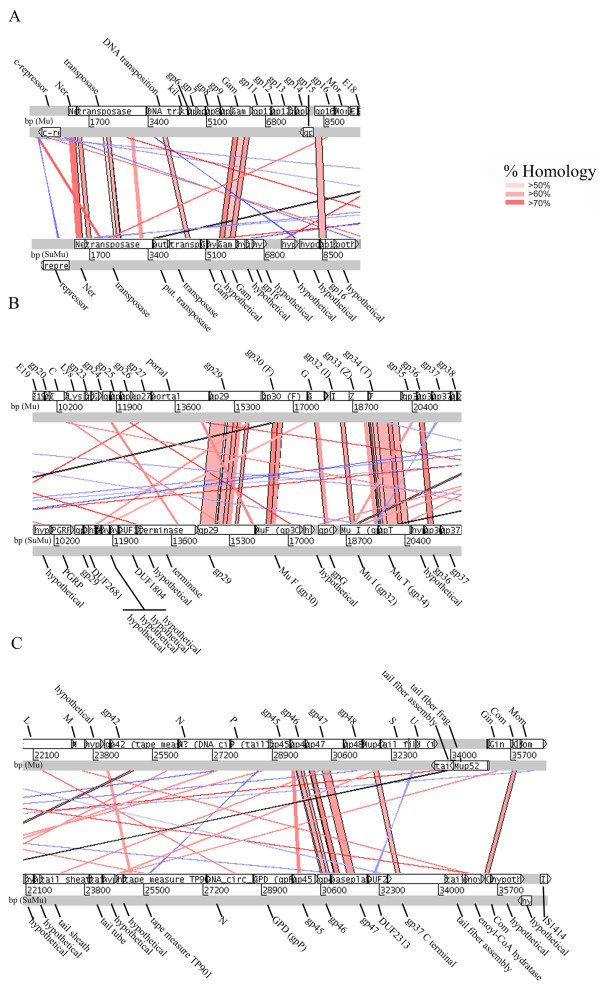
Figure 2.
Comparison of the bacteriophage SuMu DNA (lower sequence) to enterobacteriophage Mu DNA (upper sequence) using ACT: Artemis Comparison Tool [[16]]. Open reading frames are shown in white boxes under each DNA sequence and are labeled for each genome. Panel A shows CDS 1..9447, Panel B shows CDS 9617..22056, and Panel C shows CDS 22053..37151 of bacteriophage SuMu with the corresponding open reading frames in enterobacteriophage Mu. Areas of amino acid homology (forward sequence matches) found with tblastx (Search translated nucleotide subjects using a translated nucleotide query) are shown in shades of red. Homologies range from greater than 50% to greater than 70%. Black lines indicate the edges of blast matches. Areas with reverse sequence matches are shown in blue.

