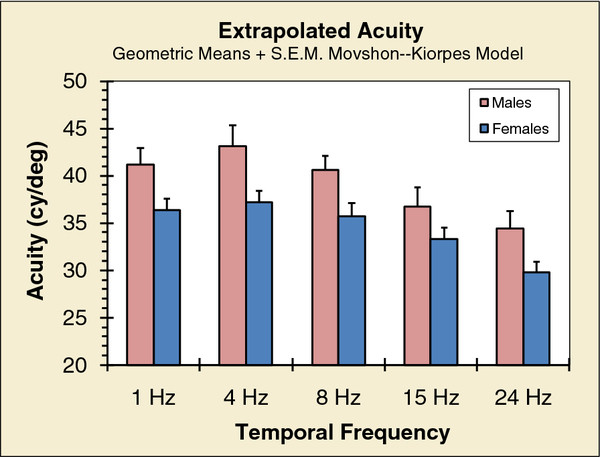
Figure 4.
Limiting acuities of males and females estimated from contrast-sensitivity functions. Each participant’s function for each of the temporal rates was fitted with a model of these functions [42]. The model functions were extrapolated to find the spatial frequency corresponding to 100% contrast. (Width of half a cycle at that frequency is the acuity limit in units of degrees.) Individuals’ estimated acuities were averaged to obtain group means.

