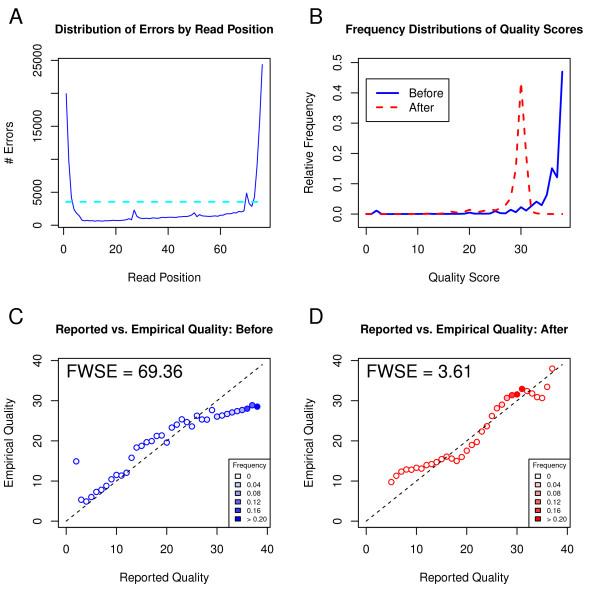
Figure 1 .
Recalibration of U87 cell line replicate 1 with ReQON. Plot A shows the distribution of sequencing errors by read position. Plot B shows frequency distributions of quality scores before (solid blue) and after (dashed red) recalibration. Reported quality scores versus empirical quality scores are shown before (plot C) and after (plot D) recalibration. The points are shaded according to the frequency of bases assigned that quality score, corresponding to the values shown in plot B. Plots C and D also report the Frequency-Weighted Squared Error (FWSE), a measure of quality score accuracy. The large decrease in FWSE confirms that the recalibrated quality scores more accurately represent the probability of a sequencing error than the original quality scores.

