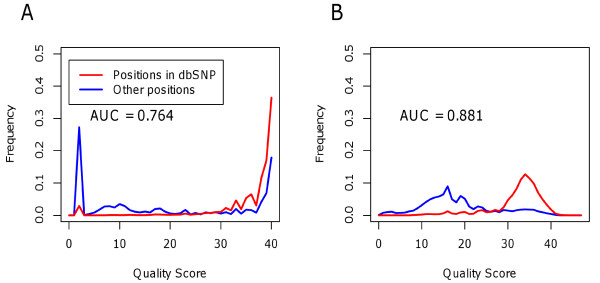
Figure 2 .
Discrimination performance of original and ReQON-recalibrated quality scores. Relative frequency distributions of quality scores for bases not matching the reference sequence in chromosome 20 of cell line replicate 2. These non-reference bases are separated as belonging to positions in dbSNP version 132 (known variants, red curve) versus other positions (sequencing errors, blue curve). Plot A shows the distribution of original quality scores and plot B shows the distribution after recalibration with ReQON. The area under the ROC curve (AUC) is reported. The increased AUC demonstrates that the recalibrated quality scores do a better job of distinguishing sequencing errors from non-errors.

