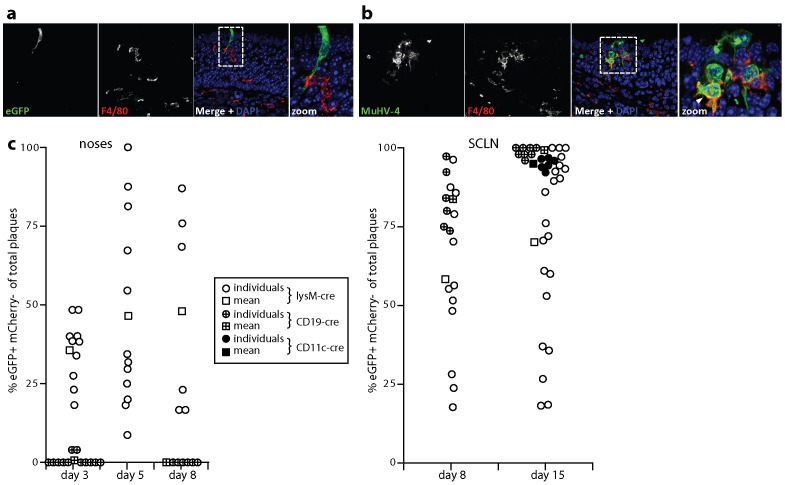
Figure 9. Tracking myeloid infection in vivo.
a. C57BL/6 mice were infected i.n. with EF1α-eGFP+ MuHV-4 (3×10⁴ p.f.u. in 5 µl) and 1 day later analysed by immunofluorescent staining of the neuroepithelium for viral eGFP (green) and for macrophages with mAb F4/80 (red). The image shows a single infected epithelial cell - that is before substantial virus spread - contacting a macrophage. b. Mice were infected as in a, then analysed 1 day later for viral lytic antigen expression with an immune rabbit serum (green) and for macrophage distribution with mAb F4/80 (red). The arrowhead in the zoomed merge shows lytic antigens in an F4/80+ cell (yellow). c. Cre transgenic mice were infected i.n. with MHV-RG (3×10⁴ p.f.u. in 5 µl), and the recovered virus analysed for cre-mediated switching from red (eGFP−mCherry+) to green fluorescence (eGFP+mCherry−). Each point shows the % eGFP+mCherry− of total plaques. Round points show individual mice, square points show means. Virus was recovered from noses by plaque assay at days 3, 5 and 8 post-infection for lysM-cre mice and at days 3 and 8 for CD19-cre mice. CD11c-cre mice were not analysed. Virus was recovered from the draining superficial cervical lymph nodes (SCLN), by infectious center assay at days 8 and 15 post-infection for lysM-cre and CD19-cre mice, and at day 15 for CD11c-cre mice. Plaques and infectious centers from non-transgenic C57BL/6 mice were 100% eGFP−mCherry+.

