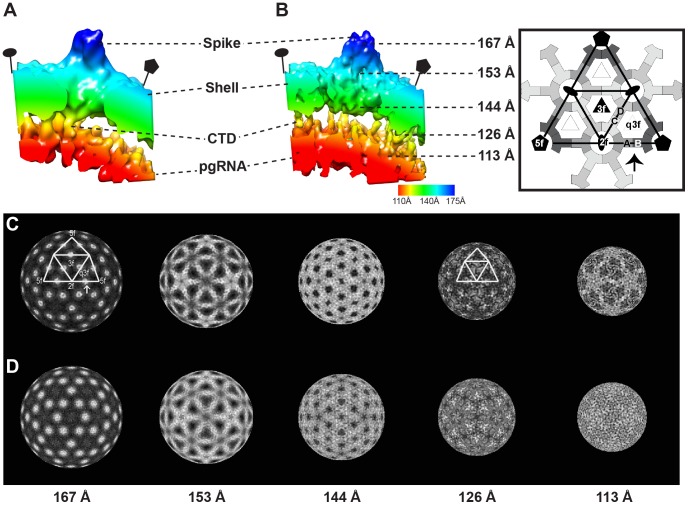
Figure 3. Interaction between the HBV capsid and pgRNA.
A radially color-coded isosurface rendering of AB dimers and related pgRNA of (A) Cp183RNA-SSS and (B) Cp183RNA-EEE viewed from a 90° rotation of the region identified by an arrow in the rightmost inset. The Cp183RNA-EEE forms a massive pentagonal density under the fivefold vertex and correlating with a thicker layer of pgRNA than seen with the Cp183RNA-SSS reconstruction. Panels of radially cued densities of (C) Cp183RNA-SSS and (D) Cp183RNA-EEE, viewed along an icosahedral twofold axis at radii of 167, 153, 144, 126, 113 Å. In these images, the protein is presented in white with the high-to-low densities indicated by the gray scale. The density distribution patterns corresponding to capsid are very similar (three leftmost elements). CTDs are expected to be dominant features through radii of 117 to at 128 Å. At 126 Å the high-density features at CD dimer in Cp183RNA-SSS are tilted toward to the threefold axis, but the related density in Cp183RNA-EEE remains at the dimer position. Notably, the CTD density correlating with the A subunit is much weaker in the Cp183RNA-SSS, whereas Cp183RNA-EEE shows a strong propeller of density along the fivefold axes. At lower radius, pgRNA density shows distinct distributions. In the Cp183RNA-SSS, the density is strongest along the twofold edge connecting fivefold axis, which forms an icosahedral cage. In the Cp183RNA-EEE the density, while thinner than in Cp183RNA-SSS, forms a more evenly distributed sphere.

