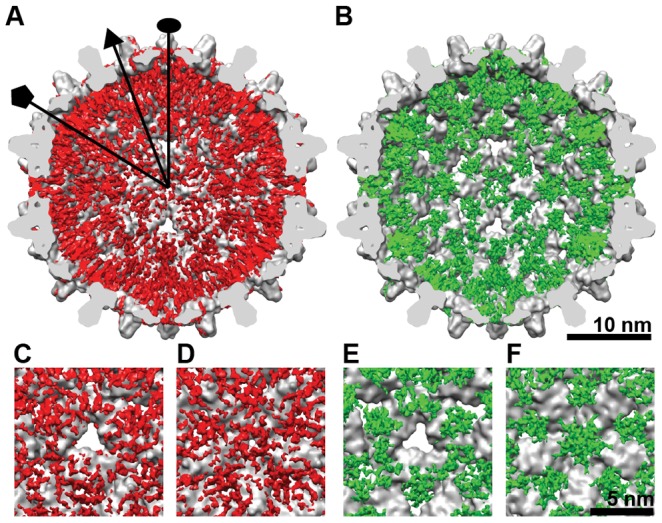
Figure 4. Spatial organization of the CTDs.

Difference maps of CTD density were calculated by subtracting the low-pass filtered atomic model of Cp149 from the (A) Cp183e-SSS and (B) Cp183e-EEE. The resulting CTD density (red and green, respectively) was superimposed on the corresponding region of the interior of the Cp149 capsid. The bottom panels shows the enlarged views at the (C,E) threefold and (D,F) fivefold axes. The overall distributions of the CTDs in Cp183e-SSS and Cp183e-EEE are very similar except that the CTD density in Cp183e-SSS is more scattered whereas the CTD density in Cp183e-EEE forms a funnel-like shape under the fivefold vertex.
