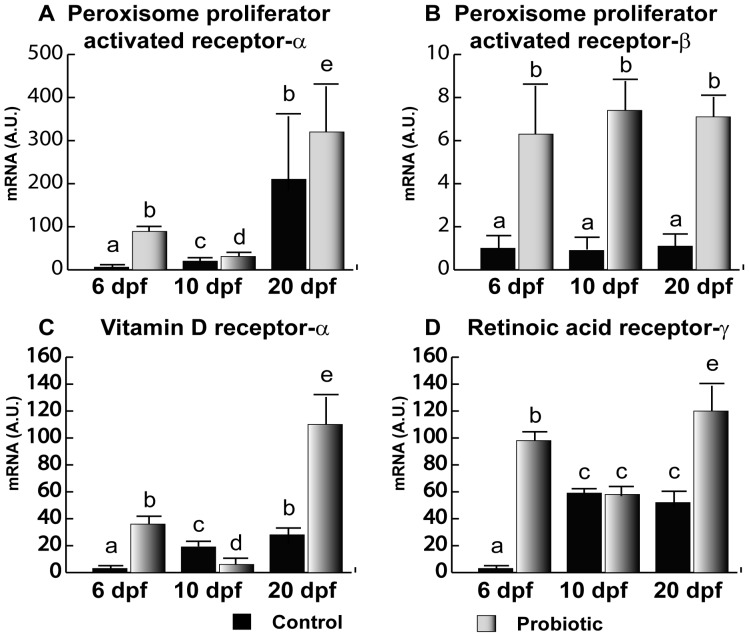
Figure 4. General development biomarkers.
Relative PPAR-α(A), PPAR-β (B), VDR-α (C) and RAR-γ (D) gene expression in zebrafish larvae from control (n = 10) and probiotic (n = 10) groups collected at days 6, 10 and 20 post fertilization (3 replicates). Values with different superscript letters are significantly different (P<0.05).

