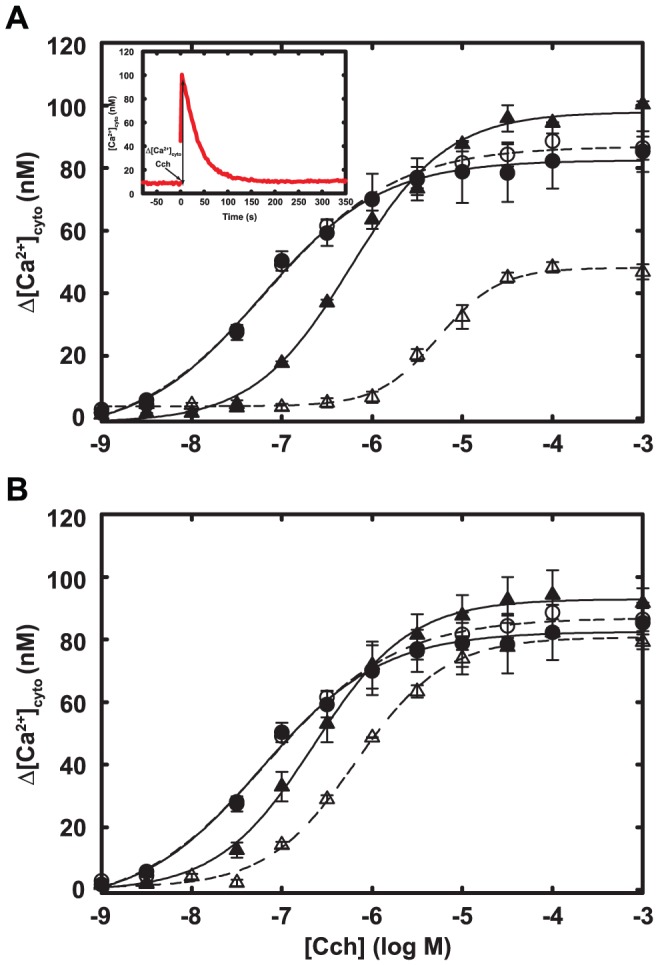
Figure 3. Agonist-stimulated Ca2+ transients in cells that express M1S1 or M1S2.

HeLa cells that transiently express wild-type m1 receptor (circles) and either M1S1 (A) or M1S2 (B) (triangles) were stimulated with the indicated concentrations of Cch and cytosolic Ca2+ transients were measured with Fluo-3 (example in inset for 1 mM Cch and wild-type receptor). Cells were either labeled with FlAsH (open symbols) or mock labeled (closed symbols). Data show the difference Δ[Ca2+]cyto) between peak and resting cytosolic [Ca2+], and lines show best fit to the Hill equation. Error bars show the range of two determinations. Similar results were obtained in at least two experiments. The same wild-type reference data are shown in both panels. Expression of M1S1 and M1S2 was about two-fold higher than that of the wild-type receptor.
