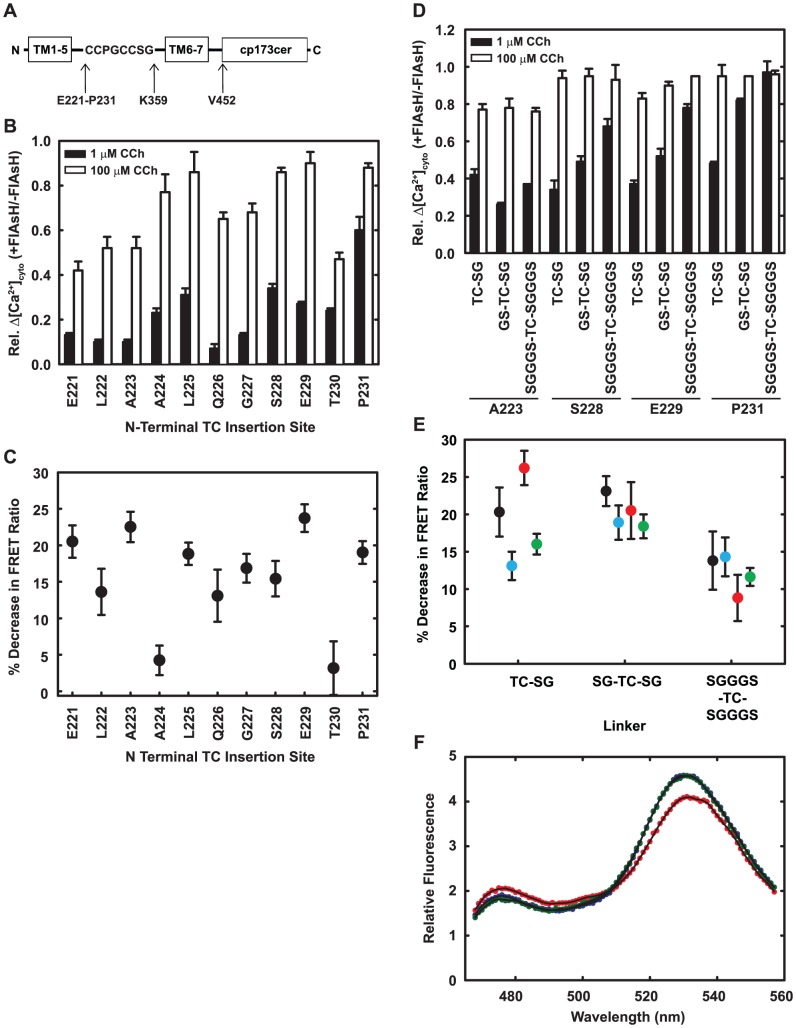
Figure 4. Optimized placement of the TC motif and the inclusion of flexible linkers reduce inhibition of signaling by FlAsH.
A: Variants of M1S1 used for optimization. B,C: Sensors with the TC motif between the residue shown and Lys359 were tested for Ca2+ signaling in HeLa cells and for FRET responses to Cch in HeLa membranes. The TC had a single Ser-Gly linker as shown in panel A. For panel B, cells were either labeled with FlAsH or mock-labeled, and tested for cytosolic Ca2+ transients in response to 1 µM and 100 µM Cch, concentrations well below the EC50 and near saturation. The graph shows the ratio of the Δ[Ca2+]cyto in labeled cells to that in mock-labeled cells. Data are averages and ranges from duplicate measurements. For panel C, membranes prepared from FlAsH-labeled cells were assayed for changes in FRET in response to 1 mM Cch. Data are averages and standard deviations from triplicate measurements. D,E: Sensors had the TC motif between the residues shown and Lys359, flanked with the indicated linkers. In panel D, sensors were tested for Ca2+ signaling as in panel B. In panel E, FlAsH-labeled membranes were assayed for Cch-induced FRET changes as in panel C. A223: black; S228: cyan, E229: red; P231: green. Panel F shows example spectra of membranes from cells that express M1S2 without ligand (blue), with 1 mM Cch (red) or 1 mM Cch plus 1 mM atropine (green). The black lines show the smoothed spectra that were used for calculation of FRET (Materials and Methods).

