
Figure 5. Agonist-driven FRET changes of M1S2-FlAsH in live HeLa cells.
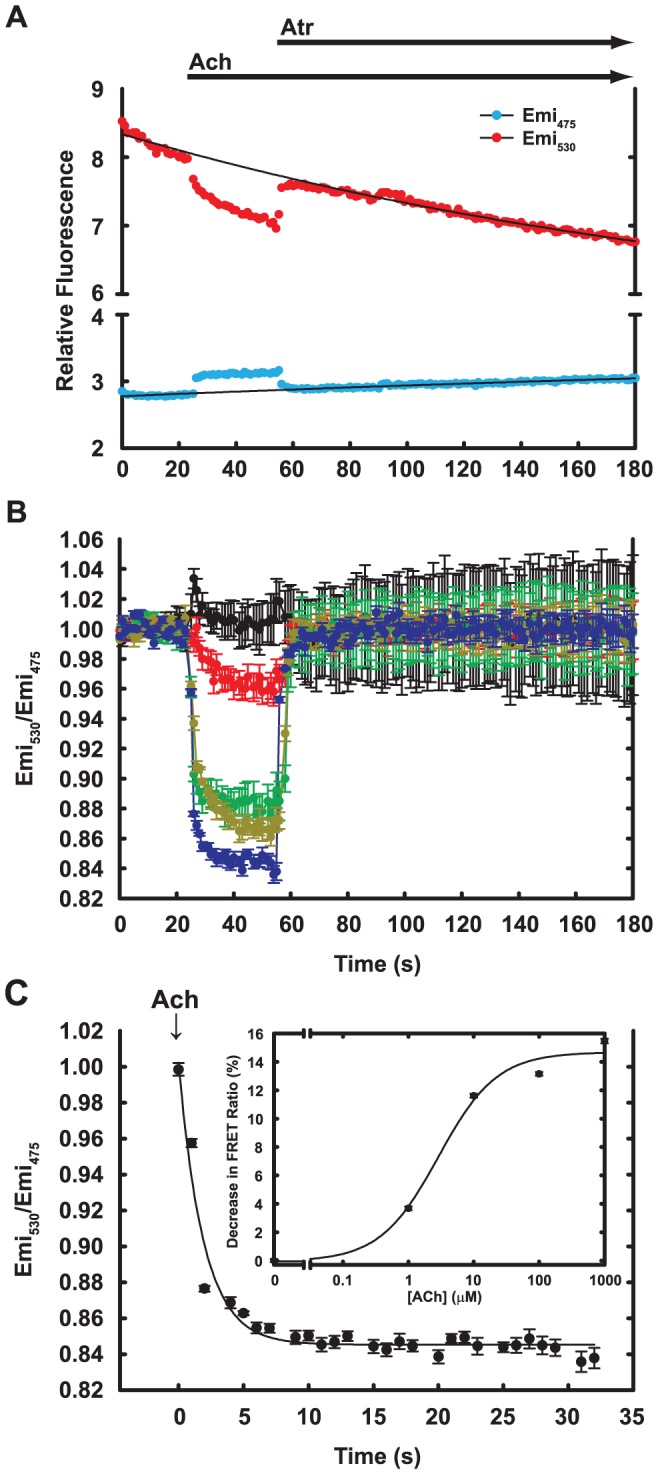
A. HeLa cells that expressed M1S2 were labeled with FlAsH and visualized by two-wavelength microscopy as described in Materials and Methods. Cell images were manually bracketed and cp173cer (Emi475) and FlAsH (Emi530) emission from individual cells were recorded. Arrows indicate addition of ligands. Acetylcholine (Ach) and atropine (Atr) were manually added at 2X and 3X final concentration (final 1 mM) respectively. Black lines are mono-exponential fits used for baseline corrections in calculations of FRET responses to ligands. B. Emission ratios (Emi530/Emi475) for FlAsH/cp173cer at increasing concentrations of Ach were obtained from data such as those shown in panel A after baseline subtraction and normalization to signals at zero time, as described in Materials and Methods. Data show averages and standard deviations from at least three isolated cells in the same imaging fields. Black: no agonist; red: 1 µM Ach; green: 10 µM; gold: 100 µM; blue: 1000 µM. C. Time course of the FRET change driven by 1 mM Ach shown in panel B, with zero time set to addition of Ach. The maximum FRET change was obtained by fitting data to a single exponential function. Inset: Maximum FRET changes at each ACh concentration, with fitting errors. The line is a fit to the Hill equation with EC50 = 2.9 µM and n = 0.97.