
Figure 6. Agonist-driven FRET changes parallel binding and cellular efficacies of agonists.
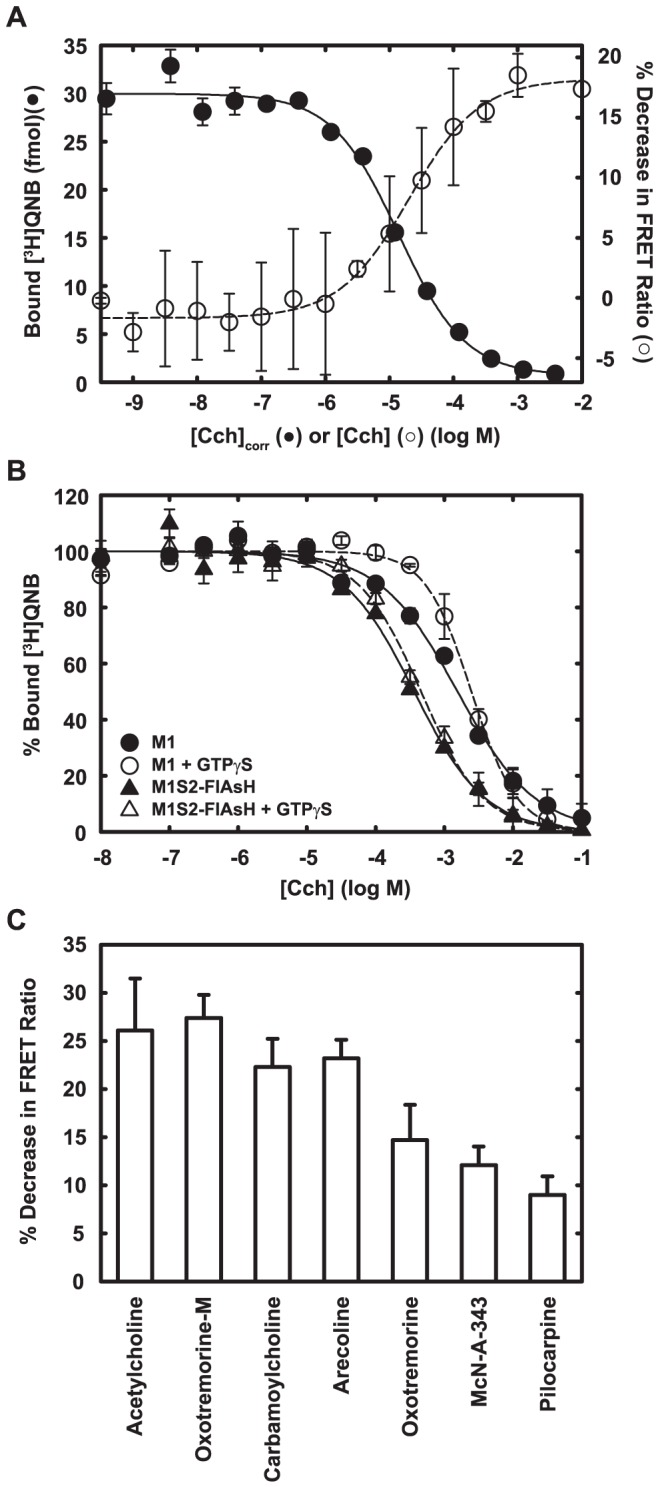
A. Cch binding (filled circle) and Cch-driven FRET changes (open circle) were measured using membranes prepared from FlAsH-labeled HeLa cells that expressed M1S2. Data are averages from duplicate measurements. Error bars show the range. Data are fitted with Hill equation. For visual comparison, the concentration of Cch for the binding curve ([Cch]corr) was corrected for the 0.5 nM [3H]QNB used in the binding assay according to KdCch = IC50/(1+[QNB]/KdQNB). KdCch, dissociation constant for Cch; IC50, half maximal inhibitory concentration; KdQNB, dissociation constant for QNB, 20 pM (determined in separate experiments). B. Binding of Cch was measured by competition against 0.5 nM [3H]QNB. When indicated (solid symbols), 50 µM GTPγS was included in the assay. Data are averages from duplicate measurements and expressed as per cent of total binding. Data are fitted with the Hill equation. M1: wild-type receptor (circle); M1S2-FlAsH, FlAsH-labeled M1S2 (triangle). C. The agonist-driven decrease in the FRET ratio was determined at saturating concentrations of each ligand, 1 mM for all ligands except oxotremorine (10 µM). Data are averages and standard deviations from triplicate measurements.