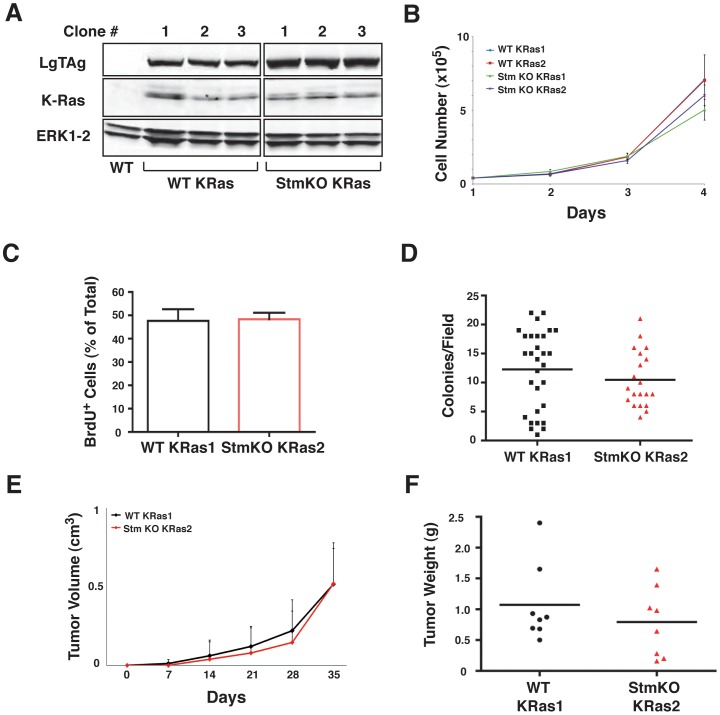
Figure 8. Tumorigenic potential of MEF transformed with LgTAg and K-Ras4bG12V does not depend on stathmin expression.
(A) Western blot analysis showing the expression of papilloma virus Large T Antigen (LgTAg) (upper panel), K-Ras (middle panel) and ERK1/2 (lower panel) in mouse embryo fibroblasts (MEF) of the indicated genotype, transduced with retroviruses encoding for LgTAg and K-Ras4bG12V. In the first lane (WT), the protein lysate from non-transduced WT MEF was used as negative control for K-Ras and LgTAg expression. (B) Growth curve analysis on two independent K-Ras clones/genotype. Data represent the mean of 3 independent experiments performed in duplicate. (C) Graph reports the analysis of BrdU incorporation in the indicated cell clones, exposed to BrdU for two hours and then fixed and analyzed by immunofluorescence. Data are expressed as percentage of BrdU positive cells respect to the total and represent the mean of 3 independent experiments in which at least 200 cells were counted. (D) Graph reports results from soft agar assay. The numbers of colonies/field (using a 10 × objective) formed by the indicated cell clones in two independent experiments are reported. The black bar indicates the median number of colonies for each cell clone. (E) In vivo growth of WT and stathmin KO MEF transformed with LgTAg + K-Ras4bG12V, evaluated by measuring tumor volume each week for 5 weeks in 8 mice/genotype. p = n.s., using the Mann Whitney test. (F) Graph reports the weight of the tumors explanted from mice injected with LgTAg + K-Ras4bG12V transformed WT and stathmin KO MEF. The black bar indicates the median tumor weight. p = n.s., using the Mann Whitney test.

