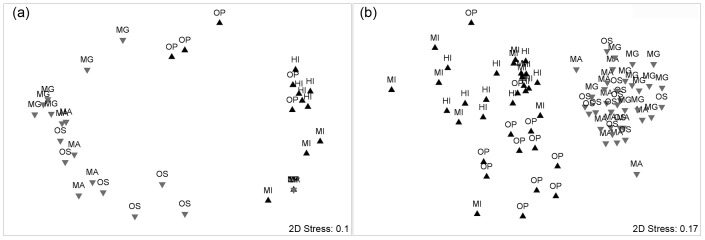
Figure 3. Non metric multidimensional scaling plots (nMDS) comparing: (a) the herbivorous fish assemblages feeding on the algal bioassays between regions (symbols) and locations (n = 6), and (b) the herbivorous fish assemblages surveyed using underwater visual census between regions (symbols) and locations (n = 6).
All data were fourth-root transformed prior to ordination. Locations have been abbreviated as follows: HI = Halfway Island, MI = Middle Island, OP = Olive Point; MG = Mangrove Bay, MA = Mandu, OS = Osprey.

