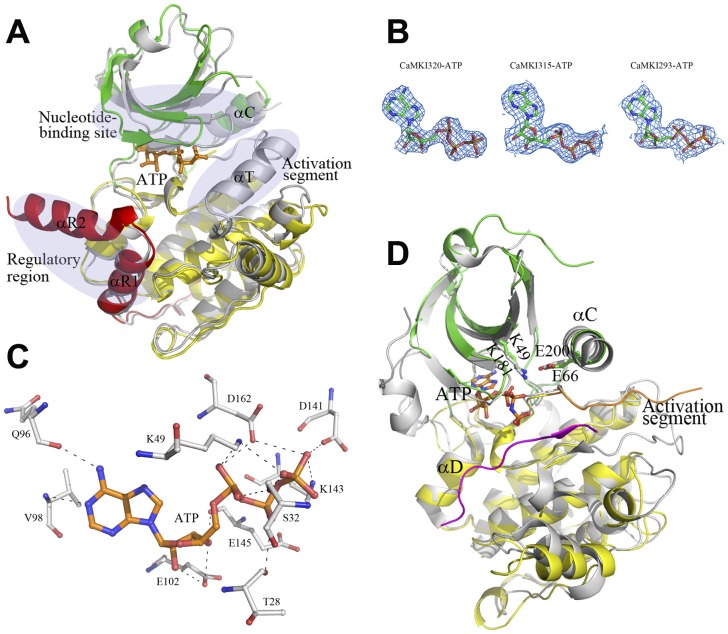
Figure 3. Structures of the ATP-bound CaMKI.
A Comparison of the CaMKI320-ATP complex with the apo CaMKI320. The CaMKI320-ATP complex is colored as in Figure 1A, and the apo CaMKI320 is colored in gray. The three regions where the CaMKI320-ATP complex shows substantial conformational differences from the apo CaMKI are indicated with ovals. B The 2Fo-Fc maps of the bound ATP molecules (contoured at 1σ level) in the CaMKI320-ATP, CaMKI315-ATP, and CaMKI293-ATP structures. C Hydrophilic interactions of ATP with the surrounding residues in CaMKI320-ATP. ATP and the interacting residues are shown with ball-and-stick models, and the hydrogen-bonding interactions are indicated with dashed lines. D Comparison of the CaMKI293-ATP complex and the Akt/PKB-GSK3β complex at the catalytic site. The color coding is the same as in Figures 1A and 2D. The bound ATP is shown with a ball-and-stick model. Glu66 on helix αC and Lys49 on strand β3 in CaMKI293-ATP and their equivalents (Glu200 and Lys181) in Akt/PKB-GSK3β are shown with ball-and-stick models.

