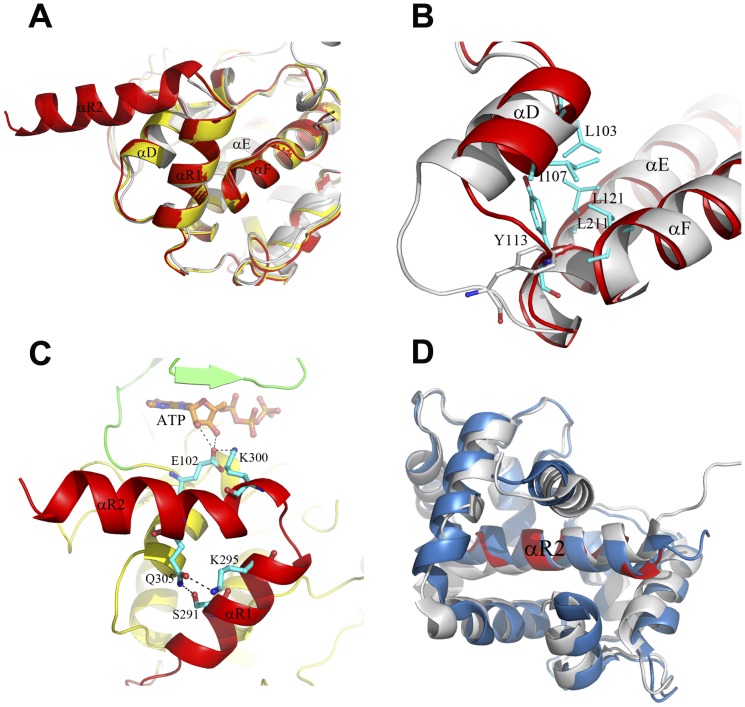
Figure 4. Structures of the regulatory region.
A Comparison of the regulatory region in the apo CaMKI320 (gray), and the CaMKI320-ATP (red) and CaMKI315-ATP (yellow) complexes. In all three structures, the autoinhibitory segment (helix αR1) interlocks with helices αD and αF. B Comparison of the conformations of helix αD and the αD-αE loop in the CaMKI320-ATP (gray) and CaMKI293-ATP (red) complexes. The involved residues are shown with ball-and-stick models and colored in cyan. C Structure of the regulatory region in the CaMKI320-ATP complex showing the functional roles of helix αR2. CaMKI320 is colored the same as in Figure 1A. Residues Lys300 and Glu305 of helix αR2 and the interacting residues including Glu102 of the hinge region and Ser291 and Lys295 of helix αR1 are shown with ball-and-stick models and colored in cyan. The hydrogen-bonding interactions are indicated with dashed lines. D Comparison of helix αR2 (residues 299–314) in the CaMKI320-ATP complex (red) with the corresponding region in the CaM-CaMKI peptide complex (blue, PDB code 1MXE) [27] and the CaMKIIδ-CaM complex (gray, PDB code 2WEL) [29]. For simplicity, only CaM and the CaM-binding segment of CaMKII in the CaMKIIδ-CaM complex are shown.

