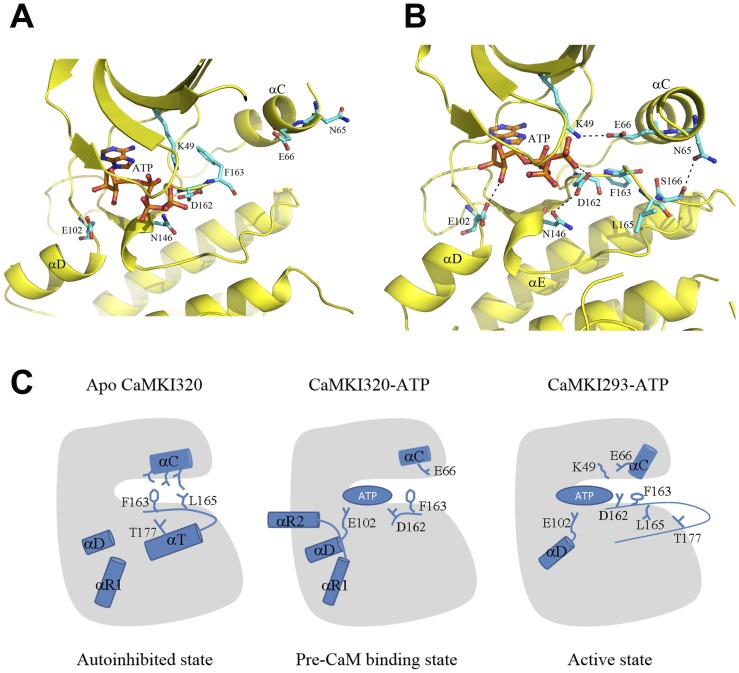
Figure 5. Model of the regulation of CaMKI.
A Structure of the catalytic site in the CaMKI320-ATP complex. B Structure of the catalytic site in the CaMKI293-ATP complex. Comparison of these two structures reveals the conformational changes upon activation. CaMKI is colored in yellow and the bound ATP in orange. In B, the residues that play important roles in the conformational changes are shown with ball-and-stick models in cyan. C A schematic diagram showing the proposed model of the regulation of CaMKI. The conversion of CaMKI from an autoinhibited state to an inactive, pre-CaM binding state, and subsequently an active state is illustrated. The α-helices that undergo conformational changes during the conversion and the key residues are indicated with cylinders and stick models, respectively. ATP is represented with an oval.

