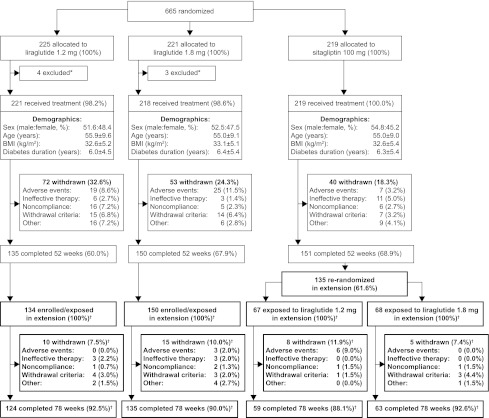
Figure 1.
Trial flow diagram. Data are n (%) participants unless otherwise noted. *Participants were withdrawn if they fulfilled withdrawal criteria, decided against participation, or did not attend any postrandomization visits. Participant disposition during the study extension is shown in bold. †Numbers and percentages of participants are from the extension analysis set.

