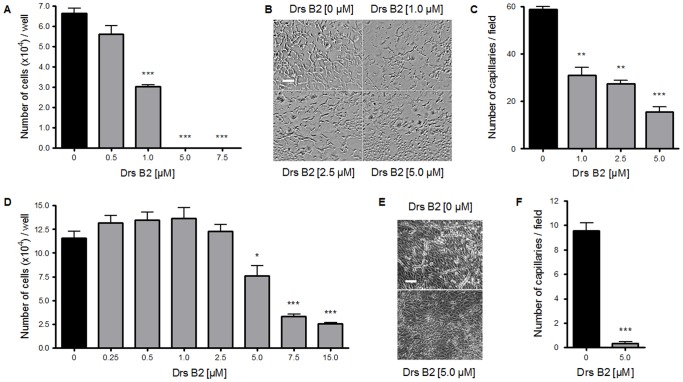
Figure 2. Effect of Drs B2 on the proliferation and differentiation of endothelial cells.
Effects of Drs B2 on human umbilical vein endothelial cell (HUVEC) A) proliferation and B, C) differentiation. B) Differentiation of HUVEC cells was performed into 24 wells plates (1.91 cm2; cell density of 4×10⁴ cells/well/0.5 mL) pre-coated with Matrigel™ (1/3 diluted). Cell culture medium and Matrigel™ were supplemented with FGF-2 (20 ng/mL). Directly after plating cells were treated with Drs B2 (1, 2.5 and 5 µM). Twenty four hours after Drs B2 treatment tube formation was observed with a phase contrast microscope, photographed (expansion 50×; bar: 250 µm) and counted. C ) Quantification of HUVEC differentiation is expressed in the number of pseudo capillaries per field. Results represent the mean of two fields ± SEM of three determinations. Effects of Drs B2 on adult bovine aortic endothelial (ABAE) cell D) proliferation and E, F) differentiation. E) Differentiation of ABAE cells on collagen induced by FGF-2 (20 ng/mL) was tested with the Montesano test (12 wells plates, 3.8 cm2; cell density of 2×10⁵ cells/well/1 mL). Directly and forty eight hours after plating cells were treated with Drs B2 (5 µM). Forty eight hours after the last treatment pseudo capillaries were observed with a phase contrast microscope and counted. Capillary formation is observed with a phase contrast microscope, photographed (expansion 10×; bar 100 µm) and counted. F ) Quantification of ABAE differentiation is expressed in the number of pseudo capillaries per field. Proliferations assays (A, D) were performed as described in Materials and Methods. Results are represented in the number of cells per well and represent the mean ± SEM of at least 3 determinations. For differentiation assays, results represent the mean of five fields ± SEM of three determinations. * p<0.05; ** p<0.01; *** p<0.001 versus control (0 µM).

