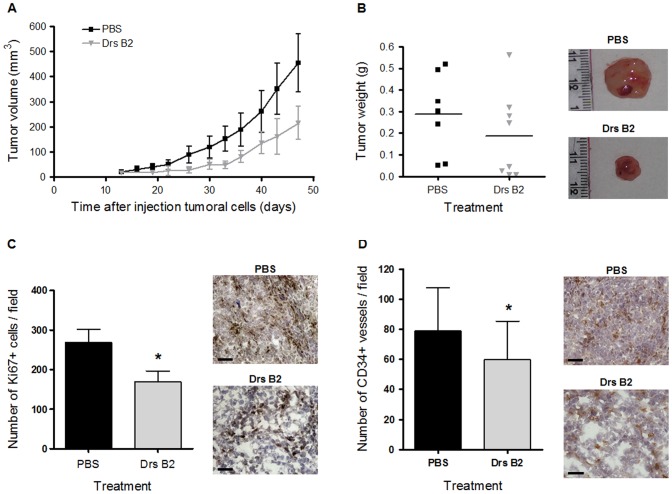
Figure 3. Effect of Drs B2 on tumor growth in vivo.
Treatment of xenografted nude mice was started thirteen days after s.c. PC3 cell injection. Experimental group (n = 8) was treated six times per week p.t. with 100 µL Drs B2 (2.5 mg/kg body weight). Control group (n = 7) was treated six times per week p.t. with 100 µL of PBS. A ) The effect of Drs B2 on tumor size versus time of treatment. After 47 days of treatment the mice were sacrificed, body weight was observed; tumors were isolated, B ) weighted and stored at −80°C. C ) PC3 tumor proliferation was evaluated by Ki67 staining of frozen tissue sections. Proliferation was quantified by image J software analysis of Ki67 positive stained cells on the whole tumor section. The data are mean areas ± SD obtained from 6 control mice and 4 mice treated with Drs B2. Scale bar, 50 µm. *p<0.05 versus control (PBS). D ) Tumor vessel formation was observed with anti CD34 antibodies. Angiogenesis was quantified by image analysis of CD34 positive stained endothelial cells. The data are mean areas ± SD obtained from 6 control mice and 4 mice treated with Drs B2. Scale bar, 50 µm *p<0.05 versus control (PBS).

