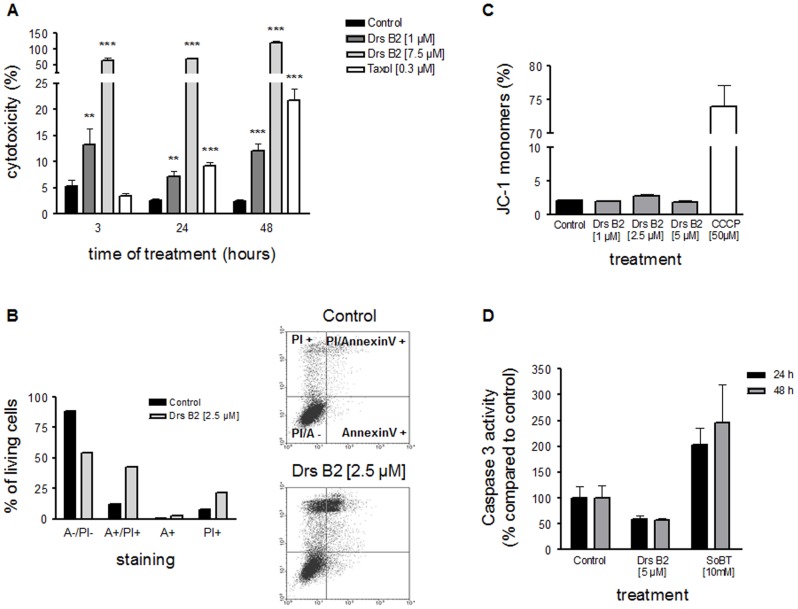
Figure 4. Mechanism of action of Drs B2 on tumor PC3 cells.
A ) Cytotoxic effect of Drs B2 on PC3: PC3 were cultured (FBS; 5%) in plastic 96 wells plates (0.035 cm2; cell density of 1.5×10³ cells/well/0.1 mL). Twenty four hours after plating cells were single treated with Drs B2 (1 or 7.5 µM). Taxol® (0.3 µM) is used as an internal positive control. LDH release was measured with CytoTox 96 kit at different time points after treatment. Results are expressed in percentage of cytotoxicity versus time of treatment in hours. Results represent the mean ± SEM of 3 determinations. * p<0.05; ** p<0.01 *** ; p<0.001 versus control (0 µM) of the related time point. B ) PC3 cell viability after Drs B2 treatment: PC3 cells were treated with Drs B2 (2.5 µM). Twenty four hours after treatment cells where double stained with FITC-Annexin-V and PI and analyzed by flow cytometry. The cell viability of PC3 cells was observed by measuring the amount of Annexin-V and PI negative and positive cells. Counter diagrams show an example of FITC-Annexin-V/PI double staining after PC3 treatment with Drs B2 (2.5 µM) during 24 hours. Graph represents the mean amount of cells per staining in %. PI−/A− = PI and Annexin-V negative; PI+ = PI positive and Annexin-V negative; A+ = Annexin-V positive and PI negative; PI+/A+ = PI and Annexin-V positive. C ) Effect of Drs B2 on mitochondrial membrane potential of PC3: PC3 cells were treated with Drs B2 (1, 2.5 and 5 µM) during 1 hour where after stained with JC-1 dye and analyzed by FACS. Change in mitochondrial membrane potential (ΔΨm) of PC3 cells was observed by measuring the amount of JC-1 monomers and JC-1 aggregates. Results are expressed in % of JC-1 monomers. Results represent the mean ± SEM of at least 2 determinations. D ) Caspase-3 activity after Drs B2 treatment: PC3 cells were treated with Drs B2 (5 µM) and SoBT (10 mM) during 24 or 48 hours. Caspase-3 activity was measured on protein lysate by using specific fluorescent caspase-3 substrate. The results are expressed in % of activity found in untreated cells and represent the mean ± SEM of at least 2 determinations performed with independent cell cultures.

