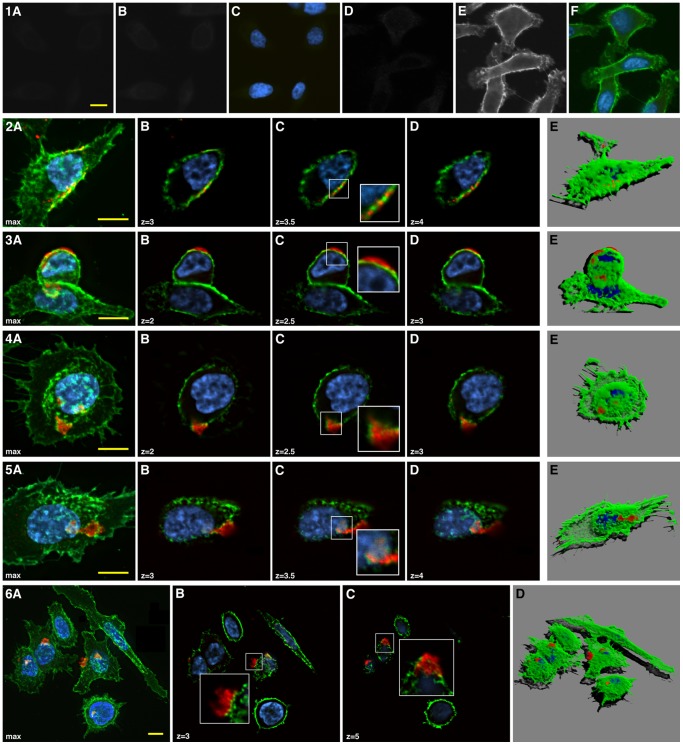
Figure 5. Immunostaining of PC3 cells after Drs B2 treatment.
PC3 cells were treated with 2.5 µM of Drs B2 during 1 hour where after fixed and stained with anti-Drs B2 polyclonal purified rabbit IgG. Drs B2 is visualized by using Fluo 546-donkey rabbit antibody (red), membranes by CD147 labeled with FITC-AffiniPure Goat Mouse antibody (green) and nuclei by DAPI (blue). Confocal fluorescence images were acquired using an IX81 inverted Olympus microscope (60× oil-immersion NA 1.25 objective) equipped with a DSU spinning disk confocal system (Olympus; Rungis, France), coupled to an Orca R2 CCD camera (Hamamatsu Corporation; Japan). Images were arranged using the image processing software ImageJ, and the program Zoom in Images and Stack. Panels 1A–C present secondary antibody controls 1A) for the Drs B2 detection by fluo 546-donkey rabbit antibody and 1B) for the CD147 detection by FITC-AffiniPure Goat Mouse antibody. Panel 1C corresponds to the composite image of 1A and 1B plus the DAPI labeling of the same field. Panels 1D–F show labeling controls for 1D) the Drs B2 detection by anti Drs B2 and fluo 546-donkey rabbit antibodies in absence of Drs B2 treatment, and for 1E) the CD147 detection by anti CD147 and FITC-AffiniPure Goat Mouse antibodies. Panel 1F corresponds to the composite image of 1D and 1E plus the DAPI labeling of the same field. Panels 2A, 3A, 4A, 5A and 6A present the maximum projection image of the composite RGB stacks along the z axis. Panels 2B–D, 3B–D, 4B–D, 5B–D and 6 B–C show the confocal image series of the same region of interest wherein z represent the distance from the base of the cell in µm (insets zoom factor = 2). Panels 2E, 3E, 4E, 5E, 6D present the 3D volume rendering of the cells from the composite RGB stacks prepared by using the software FreeSFP. Scale bar: 10 µm.

