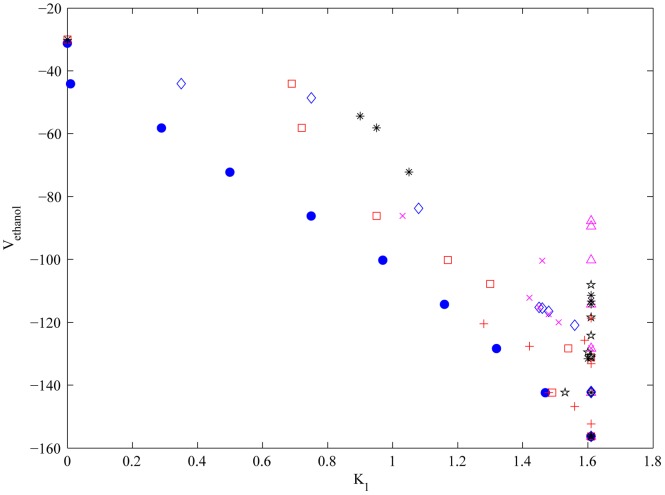
Figure 2. Pareto curve (blue circles) of the bi-criteria problem considering .
 and
and
 (Hexose transporters). The other points represent projections of the same variables obtained during other bi-criteria optimization problems:
  -
- (red squares),
  -
- (magenta triangles),
  -
- (black stars),
  -
- (blue diamonds),
  -
- (red plus signs),
  -
- (magenta cross signs) and
  -
- (black asterisks). Fold-Change factors correspond to:
  : Hexose transporters,
  : Glucokinase/Hexokinase,
  : Phosphofructokinase,
  : Trehalose 6-phosphate syntase complex (+Glycogen production),
  : Glyceraldehyde-3-phosphate dehydrogenase,
  : GOL (Glycerol production),
  : Pyruvate kynase,
  : ATPase.

