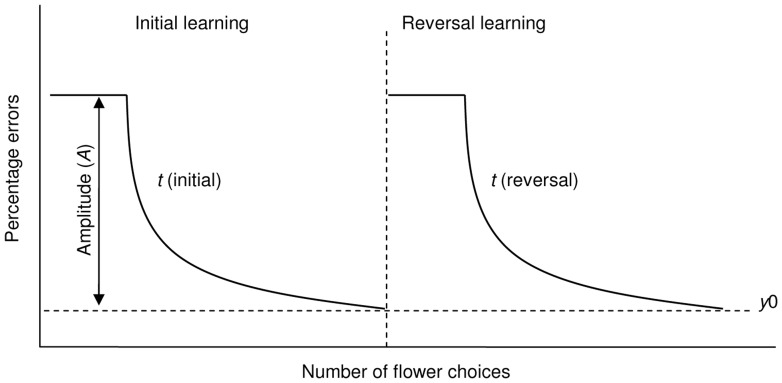
Figure 2. Schematic diagram illustrating how bee performance changes during the initial and reversal phases of the learning task.
Here, the percentage of errors (less rewarding (experiment 1) or unrewarding (experiment 2) flowers chosen) is plotted against number of flower choices made by a hypothetical bee. The initial learning phase (during which yellow flowers are (more) rewarding) is shown in the left hand panel, whilst the reversal learning phase (during which blue flowers are now (more) rewarding) is shown on the right hand side. The dashed vertical line indicates the point at which the association between floral colour and rewards are reversed. The bee starts the initial learning phase with an innate preference for blue (over yellow), hence initially chooses a high percentage of blue (less rewarding or unrewarding) flowers. Once the bee probes a (more) rewarding, yellow flower the percentage of blue flowers chosen begins to drop as it learns to associate yellow as a predictor of floral rewards. The rate of performance improvement is initially fast, before gradually levelling off to the final task performance plateau (y0). Bees return to making a high percentage of errors when the association between flower colour and reward are reversed. The yellow flowers they learned to visit in the initial learning phase are now less rewarding/totally unrewarding. As soon as bees probe a blue flower, which now contains (more) rewards, they receive positive reinforcement that this colour is now (more) rewarding.

