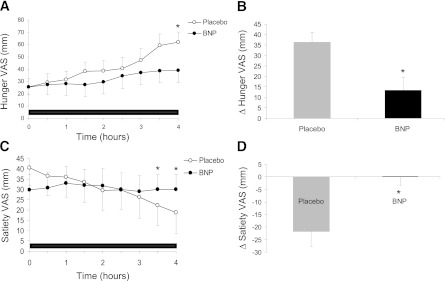
FIG. 4.
Effects of BNP on subjective ratings of hunger and satiety, as measured by VAS. Scores are depicted as change from the 0 value (mm). A: Profile of hunger VAS values. B: Differences between hunger VAS values at baseline and time point 4 h. C: Profile of satiety VAS values. D: Differences between satiety VAS values at baseline and time point 4 h. Data are presented as mean ± SEM. Horizontal black bar shows infusion duration. ●, 3 pmol/kg/min BNP; ○, placebo; *P < 0.05.

