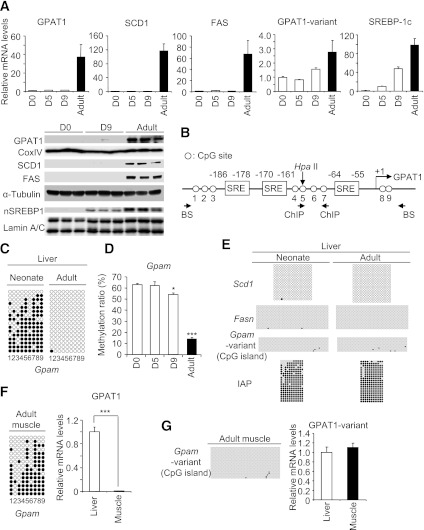
FIG. 1.
Lipogenic gene expression and DNA methylation in the neonatal and adult mice livers. A: Relative lipogenic gene and SREBP-1c mRNA levels in the neonatal (days after birth: 0, 5, and 9) and adult livers (after weaning, 10 weeks of age), examined by quantitative real-time PCR. Values for day 0 were set at 1. Western blot analysis of GPAT1, SCD1, FAS, and nuclear form of SREBP-1 (nSREBP1) in neonatal (days 0 and 9) and adult livers (10 weeks of age). For GPAT1, mitochondrial fraction was used. For FAS/SCD1 and SREBP-1, cytoplasmic and nuclear fractions were used, respectively. α-Tubulin and Lamin a/c are cytoplasmic and nuclear markers, respectively, used for loading controls. B: Schematic representation of the Gpam promoter region. The Gpam promoter contains three SREs (−186 to −178, −170 to −161, and −64 to −55, transcription start site counted as +1). Each circle denotes a CpG site, numbered 1–9. The HpaII site is indicated (arrow). Position of PCR primers for bisulfite PCR analysis (BS) and ChIP analysis are indicated. C: Bisulfite analysis of the Gpam promoter. PCR primers used in bisulfite analysis for the Gpam promoter are shown in B. Filled circles are methylated and open circles are unmethylated CpGs. The numbers beneath are as shown in B. The left panel is a neonatal liver sample (day 0), and the right panel is an adult liver sample (10 weeks of age). Representative results of three independent animals of each group with similar results are shown. D: DNA methylation of the Gpam promoter, estimated by HpaII digestion followed by quantitative real-time PCR. Genomic DNA treated with BamHI alone was prepared as an uncut control (i.e., a fully methylated control [100%]) and diluted as a standard dilution series. *P < 0.05, ***P < 0.001 compared with D0 sample; n = 3. E: Bisulfite analysis of the Scd1 and Fasn promoters and the alternative Gpam promoter, containing CpG island, and IAP in the neonatal and adult liver. Representative results of three independent animals of each group with similar results are shown. F: Bisulfite analysis and quantitative real-time PCR mRNA analysis of the Gpam promoter in the adult skeletal muscle (10 weeks of age). Values for the liver were set at 1. n = 3. For bisulfite analysis, a typical result from three independent experiments with similar results is shown. ***P < 0.001. G: Bisulfite analysis of the alternative Gpam promoter in the adult skeletal muscle and relative GPAT1-variant mRNA levels in the adult liver and skeletal muscle. n = 3. CoxIV, cytochrome oxidase IV, a mitochondrial marker.

