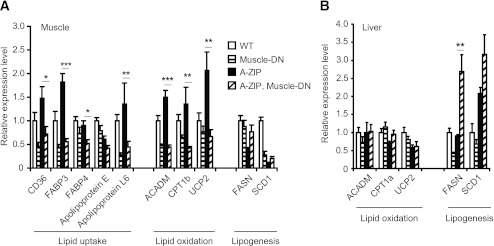
FIG. 3.
Gene expression patterns in tissues from WT mice, Muscle-DN mice, A-ZIP mice, and A-ZIP, Muscle-DN mice. Relative mRNA levels of lipid metabolism genes measured by qRT-PCR in muscle (A) and liver (B) samples of WT, Muscle-DN, A-ZIP and A-ZIP, Muscle-DN mice (n = 5–6 for all genotypes). Results are presented as mean ± SEM. Significant differences between A-ZIP and A-ZIP, Muscle-DN mice are marked. *P < 0.05, **P < 0.01, ***P < 0.001. CD36, cluster of differentiation 36; FABP, fatty acid binding protein; ACADM, acyl-coA dehydrogenase, medium chain; CPT1b, carnitine palmitoyltransferase 1b; UCP2, uncoupling protein 2.

