FIG. 3.
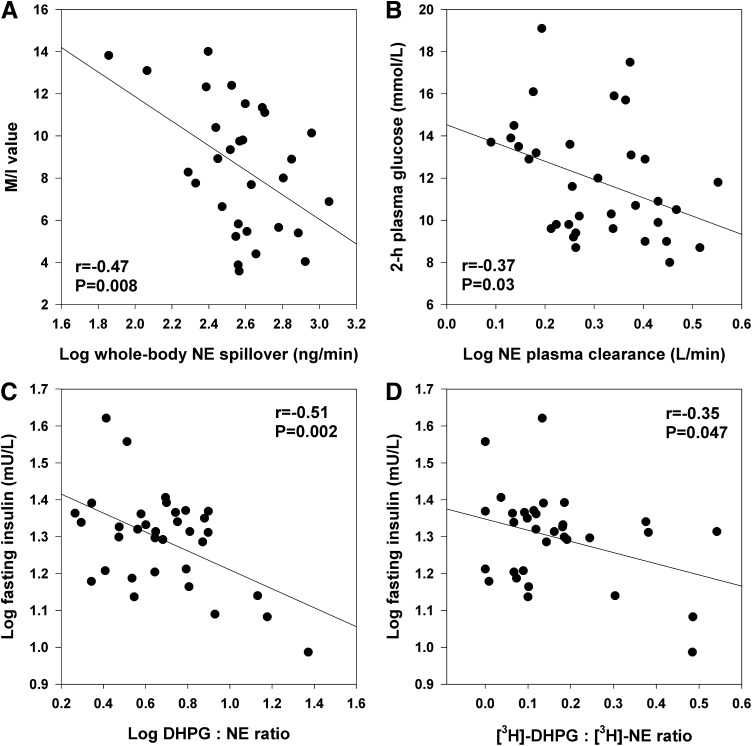
Correlates of SNS activity and function. A: Insulin sensitivity assessed with glucose clamp (M/I value, mg · kg FFM · min−1 · mU/L × 100) versus whole-body norepinephrine (NE) spillover. B: Two-hour plasma glucose concentration versus NE plasma clearance rate. C and D: Indices of neuronal NE reuptake. C: Fasting plasma insulin versus endogenous plasma DHPG to NE ratio. D: Fasting plasma insulin versus plasma tritiated DHPG to tritiated NE ratio.

