FIG. 3.
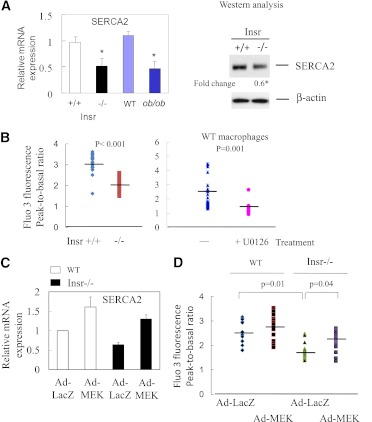
Reduced MEK signaling in insulin-resistant macrophages results in a decrease in SERCA expression and depletion of ER calcium stores. A: The levels of SERCA mRNA and protein in freshly isolated macrophages from Insr+/+, Insr−/−, lean WT, and ob/ob mice was determined by real-time QPCR and Western analysis. Fold change indicates the expression ratio of Insr−/− over Insr+/+. n = 4. *P < 0.05 for insulin-resistant macrophages vs. respective control cells. B: Releasable ER calcium in individual Insr+/+ or Insr−/− macrophage or WT macrophage pretreated with or without U0126 (5 μmol/L) was measured with calcium indicator Fura3. Fluorescence emission was collected and peak-to-basal fluorescence excitation ratio in individual cells of different groups was shown. n = 3. C: SERCA mRNA expression in WT or Insr−/− macrophages infected with either Ad-LacZ or Ad-MEK as described in Fig. 2E was determined by real-time QPCR. n = 3. D: ER calcium contents in WT or Insr−/− macrophages infected with Ad-LacZ or Ad-MEK were measured as described in B. n = 3. (A high-quality color representation of this figure is available in the online issue.)

