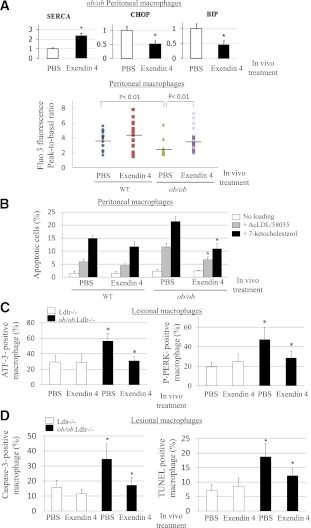
FIG. 6.
GLP-1 receptor agonist exenatide in vivo reduces basal UPR and apoptosis in macrophages of ob/ob;Ldlr−/− mice independent of plasma lipid profiles or systemic insulin sensitivity. A, top: Primary macrophages were isolated from ob/ob;Ldlr−/− mice fed WTD for 3 months and then administered either PBS or exendin 4 (20 ng/g body weight) for 2 weeks under pair-feeding condition (n = 4 for each group), and total RNA was then isolated for real-time QPCR analysis of SERCA2, CHOP, and immunoglobulin-binding protein (BIP) mRNA expression. *P < 0.05 for primary macrophages with vs. without in vivo treatment of exendin-4. A, bottom: Releasable ER calcium in individual primary macrophages isolated from WT or ob/ob mice pretreated in vivo with PBS or exendin 4 was measured with calcium indicator Fura3. Fluorescence emission was collected, and peak-to-basal fluorescence excitation ratio in individual cells of different groups was shown. n = 3. B: Primary macrophages from WTD-fed WT or ob/ob mice receiving either PBS or exendin-4 in vivo were treated with or without AcLDL (100 μg/mL) and compound 58035 (10 μg/mL) or 7-ketocholesterol (40 μg/mL). Apoptosis of macrophages was determined by annexin V staining. *P < 0.05 for free cholesterol– or oxysterol-loaded cells with PBS vs. exendin-4 treatment. n = 3. C: Double immunofluorescence staining using antibodies against UPR markers ATF-3 or P-PERK and macrophage marker Mac-3 in atherosclerotic lesions of ob/ob.Ldlr−/− and Ldlr−/− mice with in vivo treatment of PBS or exendin-4. The data of ATF-3– or P-PERK–positive macrophages are expressed as percentage of total macrophages in the same lesion areas. *P < 0.05 for saline-treated ob/ob.Ldlr−/− vs. saline-treated Ldlr−/− or vs. exendin-4–treated ob/ob.Ldlr−/− mice. n = 4–6. D: Apoptotic macrophages in atherosclerotic plaques of ob/ob.Ldlr−/− and Ldlr−/− mice with in vivo treatment of PBS or exendin-4 were detected by active caspase-3 or TUNEL as well as Mac-3 costaining. The data of caspase-3– or TUNEL-positive macrophages are expressed as percentage of total macrophages in the same lesion areas. *P < 0.05 for saline-treated ob/ob.Ldlr−/− vs. saline-treated Ldlr−/− or vs. exendin-4–treated ob/ob.Ldlr−/− mice. n = 4–6. (A high-quality color representation of this figure is available in the online issue.)

