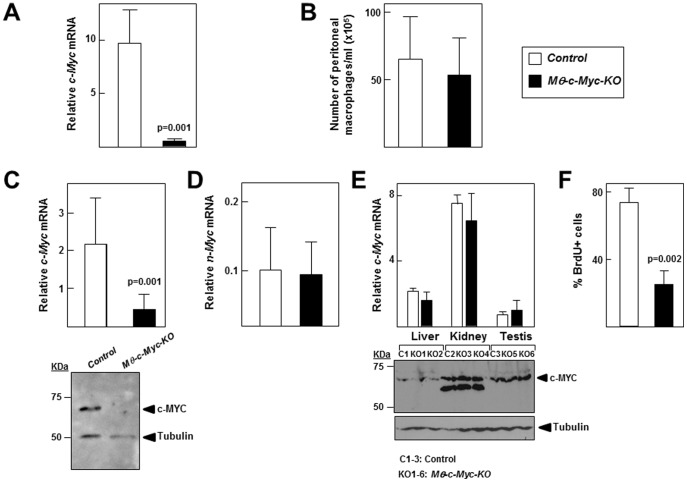
Figure 1. Mφ-c-Myc-KO mice exhibit reduced c-MYC expression in macrophages.
(A) c-Myc mRNA expression determined by qPCR in peritoneal macrophages from control and Mφ-c-Myc-KO mice (n = 7 per genotype). (B) Total numbers of peritoneal macrophages isolated from control and Mφ-c-Myc-KO mice after washing the peritoneal cavity with 3 ml PBS (n = 8 mice per genotype). (C) Expression levels of c-Myc mRNA (top, n = 6 per genotype) and c-MYC protein (bottom, representative blot) in BMDMs. (D) n-Myc mRNA expression determined by qPCR in BMDMs from control and Mφ-c-Myc-KO mice (n = 4 per genotype). (E) Expression levels of c-Myc mRNA (top) and protein analyzed by western blot (bottom) in liver, kidney and testis (n = 3 control, n = 6 Mφ-c-Myc-KO). (F) BMDM proliferation assessed by 5′-bromodeoxyuridine (BrdU) incorporation (n = 3 per genotype).

