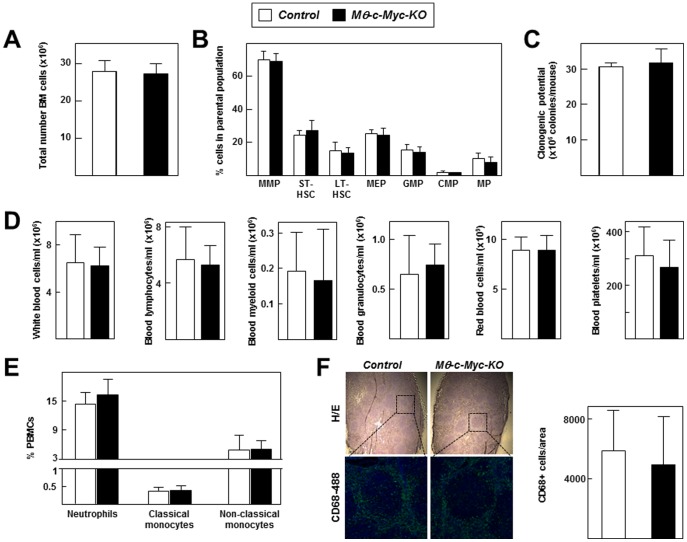
Figure 2. Characterization of the immune system of Mφ-c-Myc-KO mice under steady-state conditions.
All parameters were analysed in 6 mice per genotype. (A) Total numbers of bone marrow cells isolated from mice after flushing femurs and tibias with PBS. (B) Flow cytometry analysis of bone marrow precursors. MMPs, LT-HSCs, ST-HSCs were analyzed by double immunostaining for Flk2 and Cd90 within the parental Lin− Sca1+ c-Kit+ (LSK) population. MEPs, GMPs and CMs were analyzed by double immunostaining for CD16 and CD34 within the parental LSK population. MPs were detected by staining for CD115+ within the parental Lin− population. (C) Clonogenic activity of total bone marrow cells. (D) Blood hemogram analysis for the indicated cell types. (E) Flow cytometry of blood cells doubly stained for Gr-1 and CD115 to identify neutrophils (Gr-1highCD115−), classical monocytes (Gr-1highCD115+) and non-classical monocytes (Gr-1−CD115+). (F) Spleen sections were either stained with hematoxilin/eosin or analyzed by confocal microscopy to visualize macrophage infiltration (CD68+ cells) and nuclei (DAPI staining). Representative images are shown, with higher magnification for CD68 immunofluorescence showing macrophage-rich red pulp surrounding a spleenic follicle. The graph shows the quantification of CD68+ macrophages within the spleen using Imaris software (n = 3 tumors per genotype).

