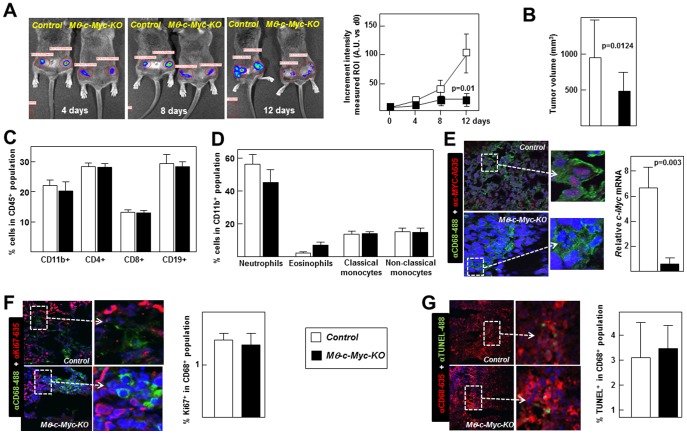
Figure 3. Mφ-c-Myc-KO mice are resistant to growth of tumors derived from injected B16 melanoma cells.
(A) B16 melanoma cells expressing firefly luciferase were injected subcutaneously into both flanks of mice, and tumor growth was monitored over two weeks post-grafting with the Xenogen IVIS 100 Bioluminescence in vivo imaging system (n = 6–8 tumors per genotype). (B) Tumor volume after sacrifice at two weeks post-injection (n = 16 tumors per genotype). (C) Flow cytometry analysis for circulating CD11b+ myeloid cells, CD4+ T lymphocytes, CD8+ T lymphocytes and CD19+ B lymphocytes in mice two weeks after tumor injection (n = 7, control; n = 8 Mφ-c-Myc-KO). (D) Flow cytometry detection of circulating myeloid cells two weeks after tumor injection (n = 7, control; n = 8, Mφ-c-MYC-KO) (E) Representative confocal images showing double immunofluorescence to visualize macrophages (CD68+ cells) and c-MYC expression in tumors, and quantification of c-Myc mRNA in TAMs isolated by sorting tumor cell suspensions (n = 3 mice per genotype; two tumors pooled per mouse). (F) Representative confocal images and quantification of proliferating TAMs (CD68+Ki67+) (n = 6 tumors per genotype). (G) Representative confocal images and quantification of apoptotic TAMs (CD68+TUNEL+) (n = 6 tumors per genotype).

