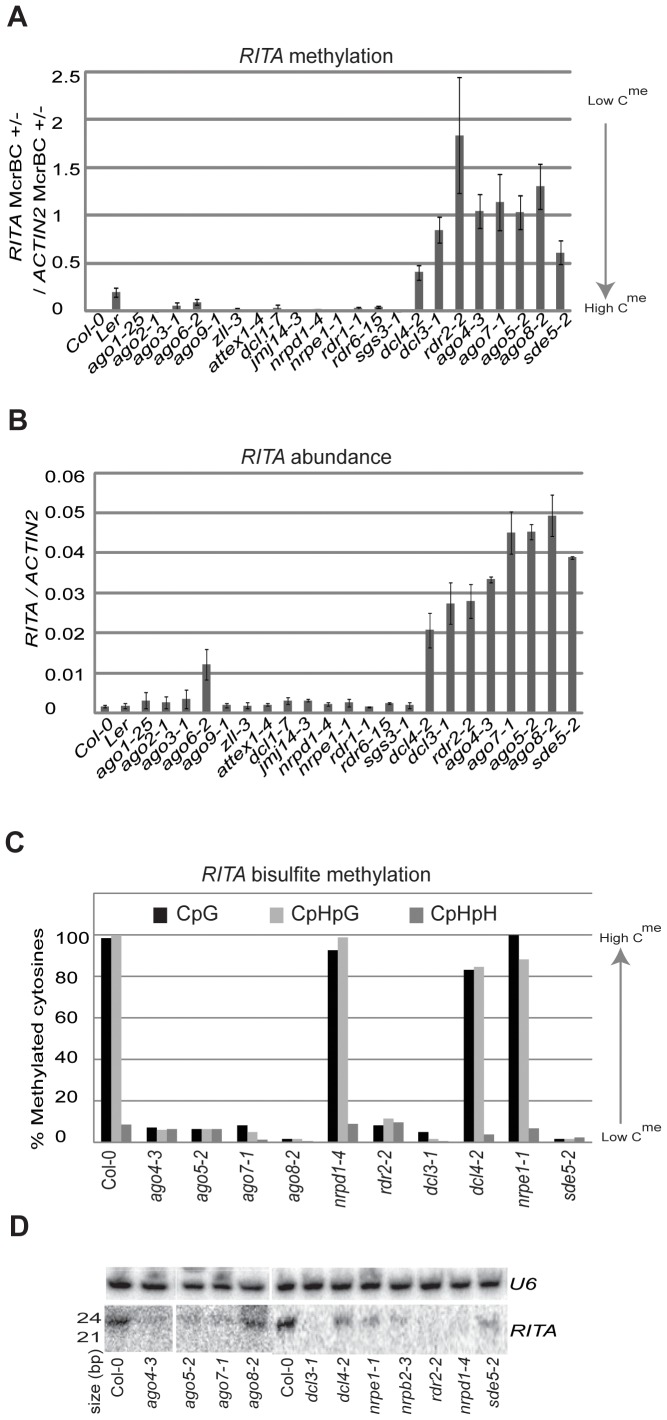
Figure 1. RITA characterization.
(a) Methylation of RITA in seedlings as estimated by McrBC digestion in a panel of mutants. (b) RITA transcript abundance in seedling in a panel of mutants. (c) Bisulfite sequencing of RITA. Y-axis indicates percent of methylated cytosines. (d) sRNA northern blot using RITA probe. U6 is a loading control.

