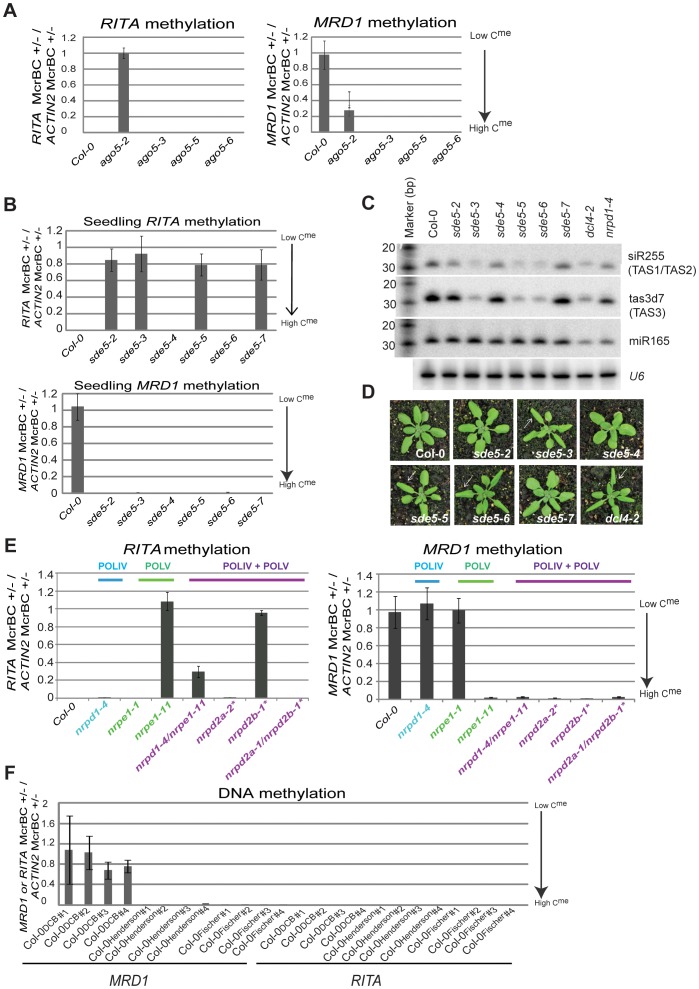
Figure 3. RITA and MRD1 epigenetic statuses in various allelic series.
(a) Methylation (estimated by McrBC digestion) of RITA and MRD1 in the AGO5 allelic series. (b) McrBC estimation of the methylation levels of RITA and MRD1 in an SDE5 allelic series. (c) sRNA northern blot for SDE5 allelic series. miR165 and U6 are loading controls. (d) SDE5 allelic series mutant phenotypes. White arrows highlight accelerated juvenile-adult transition phenotype in leaves. (e) Methylation of RITA and MRD1 in seedling RNA polymerase mutant alleles. The lines indicated with a * are also known to be mutants in the POLV complex (NRPE). (f) DNA methylation of RITA and MRD1 in Col-0 lines obtained from different lab (denoted by the principal investigator’s surname). #’s refer to individual plants; 4 individuals were assayed per line.

