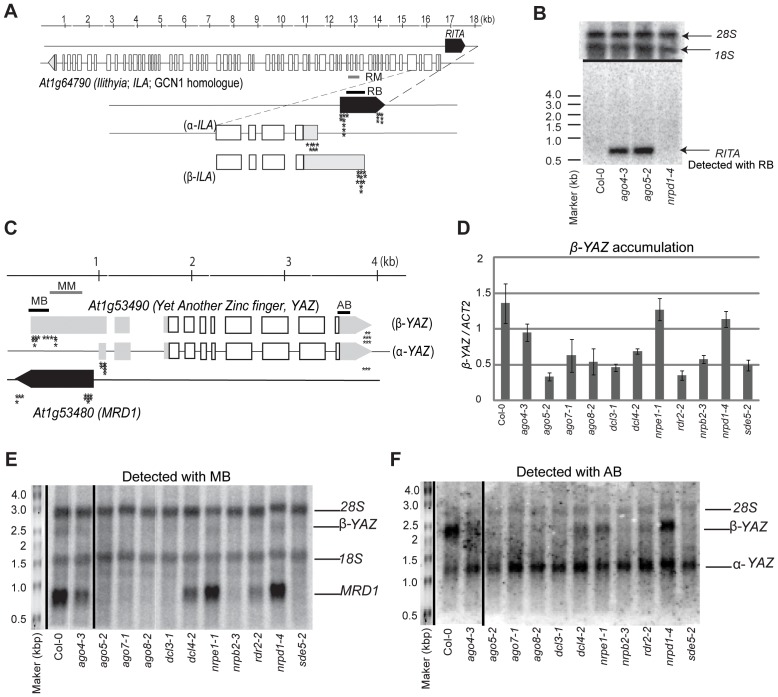
Figure 5. Analysis of RITA and MRD1 locus transcripts.
(a) Schematic of RITA/ILA locus. Stars indicate the location of individual 5′ and 3′ RACE clones. A ruler present is present above to estimate sizes. Open boxes indicate coding regions, gray shading indicated untranslated regions (UTRs) and black shading indicates RITA or MRD1 RNAs. RM is the region assayed by bisulfite sequencing with oligos DBO489 and DBO490. RB is the region covered by McrBC assay using the oligos DBO447 and DBO448. MB was also used to probe the long RNA northern in (b). (b) Long RNA northern probed for RITA. 18S and 28S ribosomal RNAs indicate loading. (c) Schematic of MRD1/YAZ locus indicating amplicons (MB and AB) used for long RNA northern blot probes. MB was used for the McrBC assay with oligos DBO547 and DBO762. MM refers to the region assayed by bisulfite sequencing with the oligos DBO600 and DBO601. Stars indicate the location of individual 5′ and 3′ RACE clones. A ruler present is present above to estimate sizes. Open boxes indicate coding regions, gray shading indicated UTRs and black shading indicates non-coding RNAs. (d) RT-PCR for β-YAZ accumulation normalized to ACT2. (e) Long RNA northern blot with a probe (MB) that detects β -YAZ and MRD1, along with the non-specific hybridization of 18S and 28S ribosomal RNAs. (f) Long RNA northern blot with a probe (AB) that detects β -YAZ and α-YAZ. Loading is shown by 18S and 28S ribosomal RNAs in (e).

