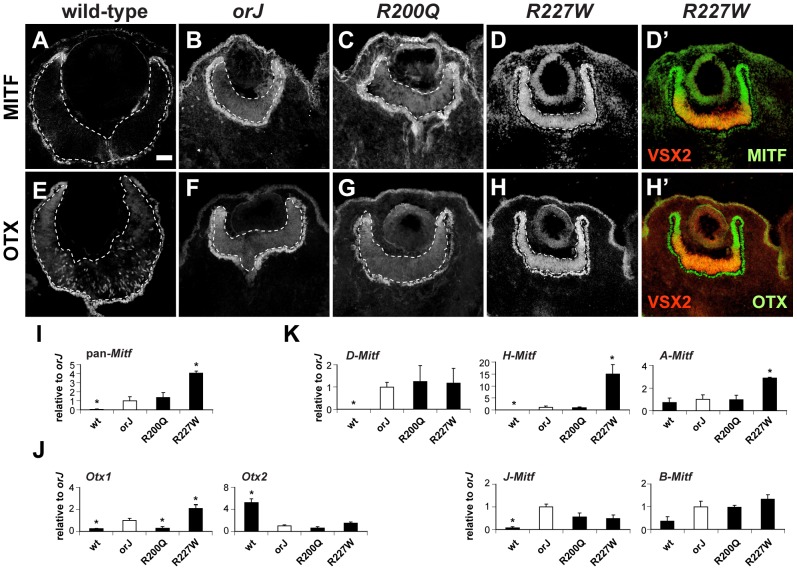
Figure 5. Phenotypic severity correlates with the expression levels of Mitf and Otx1.
(A–D) MITF expression at E12.5 for the indicated genotypes. The R227W retina expressed MITF at much higher levels compared to the orJ and R200Q mutants. (D′) Merged images of VSX2[R227W] (red) and MITF (green) shows overlap in expression. The lack of VSX2[R227W] expression in the peripheral retina corresponded to the highest levels of MITF. (E–H) OTX expression at E12.5 for the indicated genotypes. OTX expression was highest in the R227W retina. (H′) Merged images of VSX2[R227W] (red) and OTX (green). Like MITF, OTX expression was highest in regions lacking VSX2[R227W]. MITF and OTX were also expressed in RPE (outside lower dashed lines). (I–K) Relative mRNA expression levels of pan-Mitf (I), Otx1 and Otx2 (J), and the D-, H-, A-, J-, and B-Mitf isoforms (K) in E12.5 retinas of the indicated genotypes as determined by qRT-PCR. Samples were normalized to the expression level for each transcript in the orJ retina (white bars). * P≤0.05 Scale bar: 50 µm.

