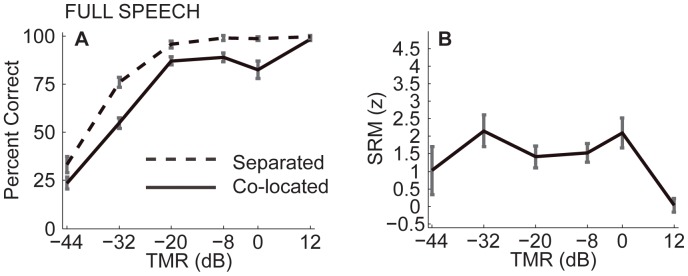
Figure 3. Performance from Experiment 1 with unprocessed speech as a function of target to masker broadband energy ratio (TMR).
Error bars show estimated 95% confidence intervals after correcting for between-listener variance. A) Percent correct for spatially separated sources (dashed line) and co-located sources (solid line). Performance was better in the spatially separated than in the co-located configuration, a phenomenon referred to as spatial release from masking. B) Spatial release from masking (SRM), i.e., the difference between the dashed and solid lines in panel A), expressed in z-units (see text for details on Data Analysis).

