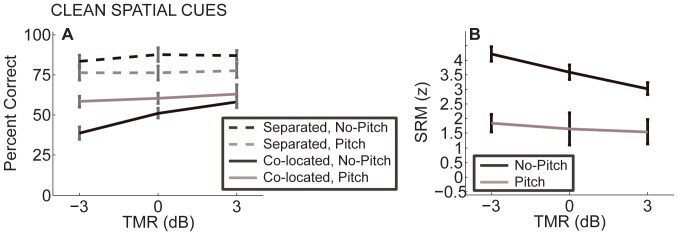
Figure 4. Performance from Experiment 2 with chess-vocoded speech with clean ITD cues as a function of TMR.
Error bars show 95% confidence intervals. A) Percent correct for spatially separated sources (dashed line) and co-located sources (solid line). B) SRM. Performance was consistently better in the spatially separated than in the co-located configurations. SRM was greater for the No-Pitch condition than for the Pitch condition.

