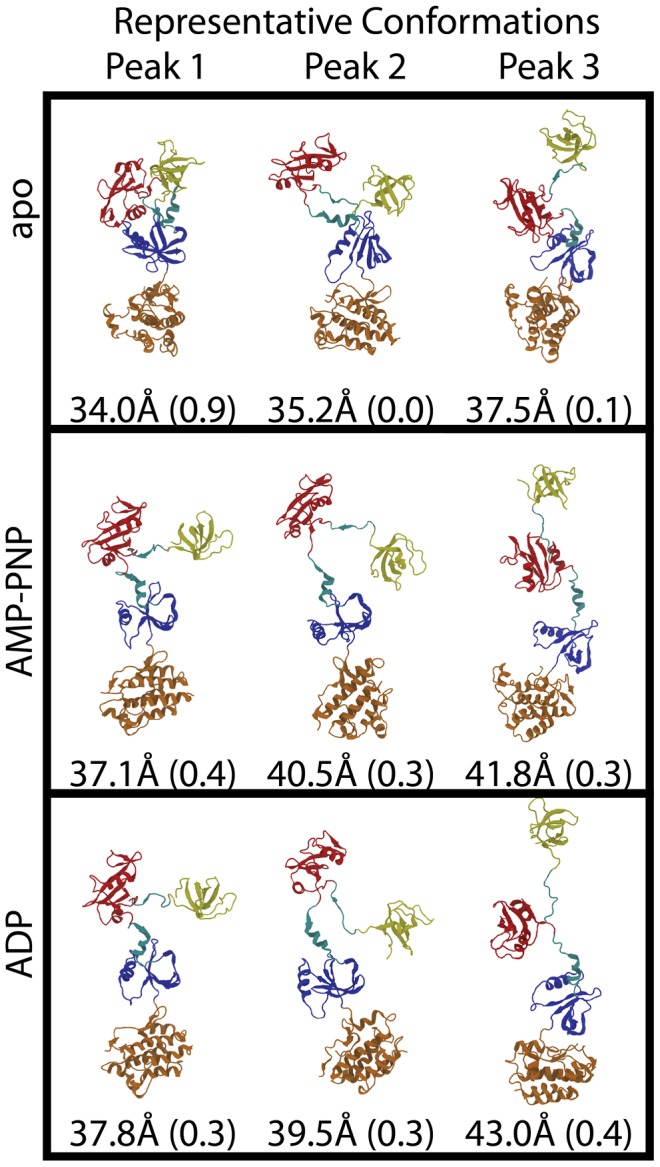
Figure 3. Representative conformations from the peaks of the P(Rg) plot, along with their Rg values.

Appearing next to the Rg values of each conformation is the fraction of the best-fit ensemble made up by that conformation. For all conformations the SH3 domain appears in yellow, the SH2 domain appears in red, the N-lobe of the kinase domain appears in blue, the C-lobe of the kinase domain appears in orange, and the domain-domain linkers appear in cyan.
