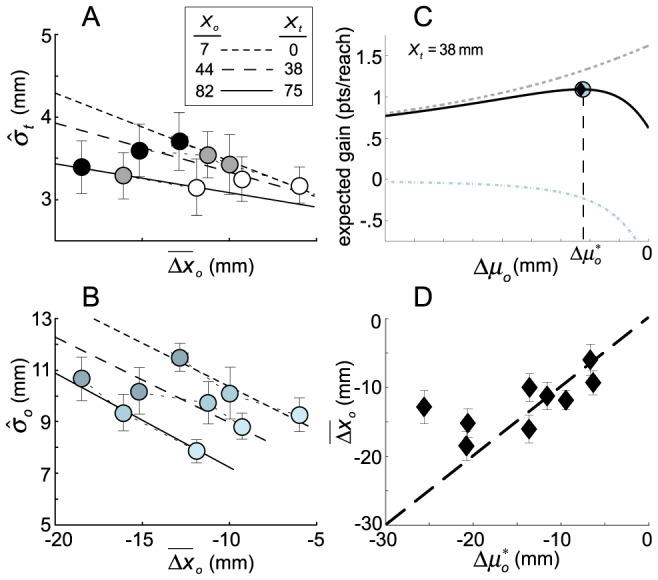
Figure 5. Planned trajectories maximizing expected gain.

A. Plot of  versus
  for each obstacle position
  and cost
  (grey level). Error bars are ±1 standard error. Lines show weighted least-squares fits of the variation of
  with mean excursion in the obstacle plane
  for each obstacle location across subjects. B. Plot of
  versus
  for each obstacle position
  and each cost
  . Error bars are ±1 standard error. Lines show weighted least-squares fits of variation in
  with mean obstacle plane excursion (
 ) at each obstacle location across subjects. In panels A and B, increasing cost magnitudes correspond to darker symbol shading. The fits in these panels represent our estimates of the linear functions relating excursion size
  to standard deviations
  and
and  in the two critical planes. C. An example of how expected gain varies as a function of theoretical excursion
  for one experimental condition. Panels A and B form the basis for predictions of covariance changes as a function of any planned excursion (
 ) in each experimental condition, which in turn allows for prediction of the effect of
  on expected gain. As obstacle plane excursions
  decrease (the trajectory moves closer to the obstacle), the probability of hitting the obstacle increases and the expected cost (plotted as a blue dot-dashed curve) magnitude increases. At the same time, the probability of hitting the target increases and the expected reward incurred by hitting the target increases (grey dashed curve). The expected gain, the sum of the expected cost and expected reward, is the solid back curve that attains its maximum (
 ) at the location of the blue dot. For comparison, the mean excursion across subjects for this condition (
 ) is plotted as a black diamond. D. A plot of the observed average excursion (±1 standard deviation) in the obstacle plane
  (averaged across subjects) versus the optimal shift that would maximize expected gain
  at each of the nine experimental conditions.
