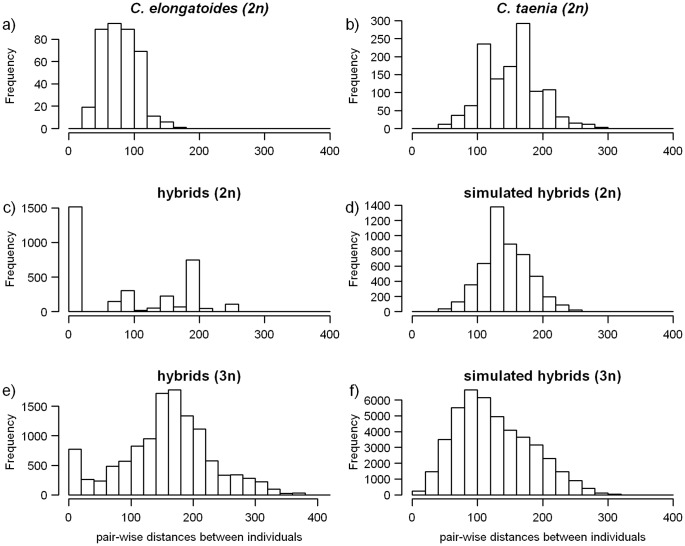
Figure 2. Histograms of the frequency distribution of pairwise distances in bp among genotyped individuals.
(a–b) Data from C. elongatoides and C. taenia; (c–d) Distributions from observed (natural) and simulated diploid hybrids; (e–f) distributions from the observed (natural) and simulated triploid hybrids.

