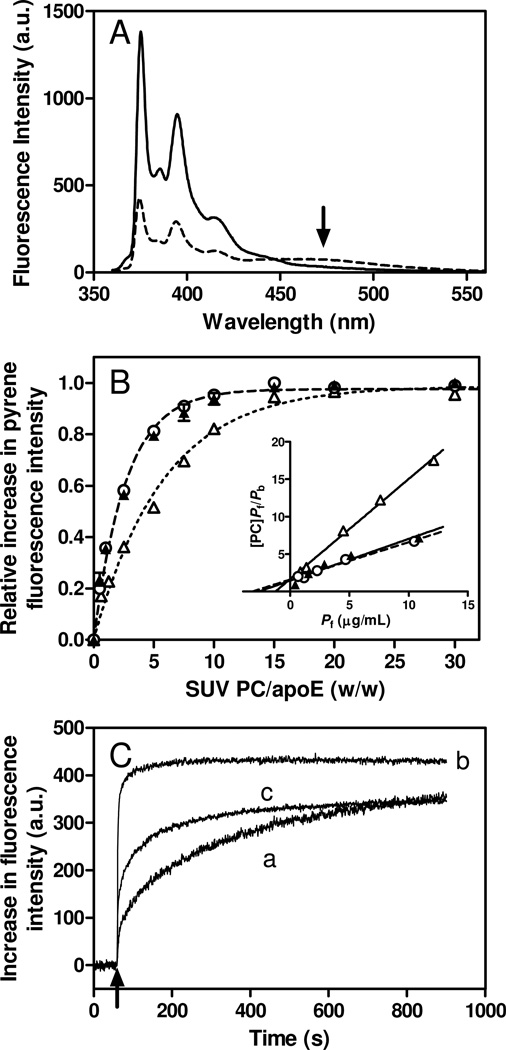
Fig. 4.
(A) Pyrene fluorescence emission spectra of apoE S290C-pyrene in the lipid-free (dashed line) or bound to egg PC SUV (solid line). The arrow draws attention to the excimer peak at around 470 nm. Protein and PC concentrations were 25 µg/ml and 1.5 mg/ml, respectively. (B) Increases in fluorescence intensity of apoE4 S94C-pyrene (Δ), W264C-pyrene (○), and S290C-pyrene (▲) upon binding to egg PC SUV as a function of the weight ratio of PC to apoE4. Protein concentration was 25 µg/ml. The inset shows the linearized plots according to Hanes-Woolf equation (see Experimental Procedures). (C) Time courses of increases in fluorescence intensity upon binding to egg PC SUV for apoE4 S94C-pyrene (trace a), W264C-pyrene (trace b), and S290C-pyrene (trace c). SUV was added to apoE4 variants at final concentrations of 10 µg/ml protein and 0.4 mg/ml PC. Pyrene fluorescence was monitored at 385 nm with an excitation of 342 nm.

