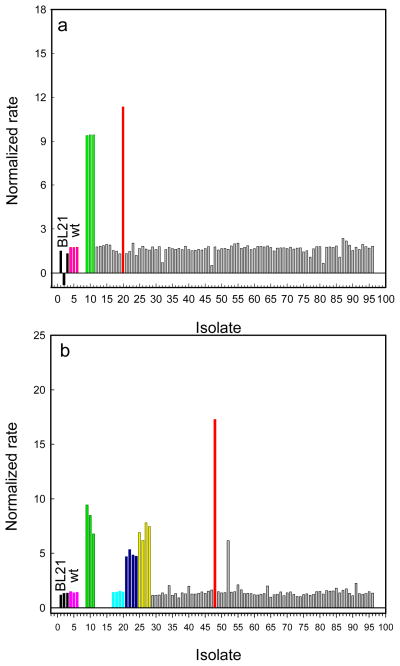
Figure 2.
(A) Screening of the 6-site randomized library using GWT-f1 as the parental template with Sp-5. The bars in light green and red represent the relative catalytic activity of the GWT-f1 and GWT-f3 mutants, respectively. (B) Screening of the error-prone PCR library using GWT-f4 as the parental template with Sp-5. The bars in light green, cyan, dark blue, yellow and red represent the GWT-f4, GWT-f4-G129D, GWT-f4-I228F, GWT-f4-G254W and GWT-f5 mutants, respectively.

