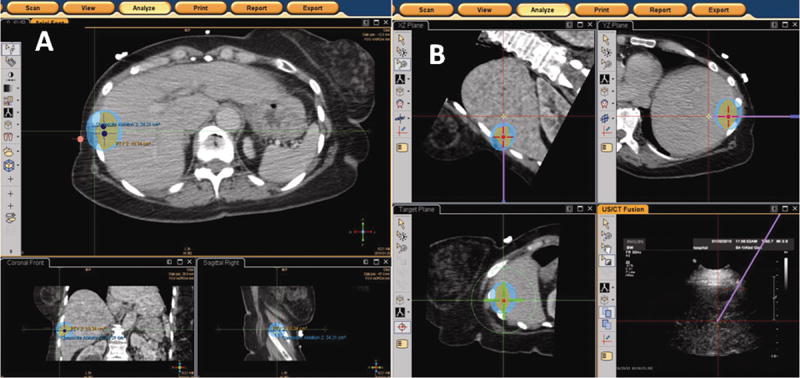
Figure 4.
a–b: Figure 4a [left] and 4b [right] Screenshot display of EM tracking-based ablation planning software platform. The software enables the operator to segment the tumor, which is displayed as an orange-colored circle. The expected treatment area is shown as the blue ellipse. Positions of the RF probe required to achieve the desired tumor coverage are shown as the navy dots (figure 4a). The operator can navigate to the desired probe locations and adjust the treatment plan if the needle positioning deviates from the plan. The virtual needle path is overlaid on both the multiplanar reconstructions (purple solid line) and on the “bull’s eye” view (green crosshairs).

