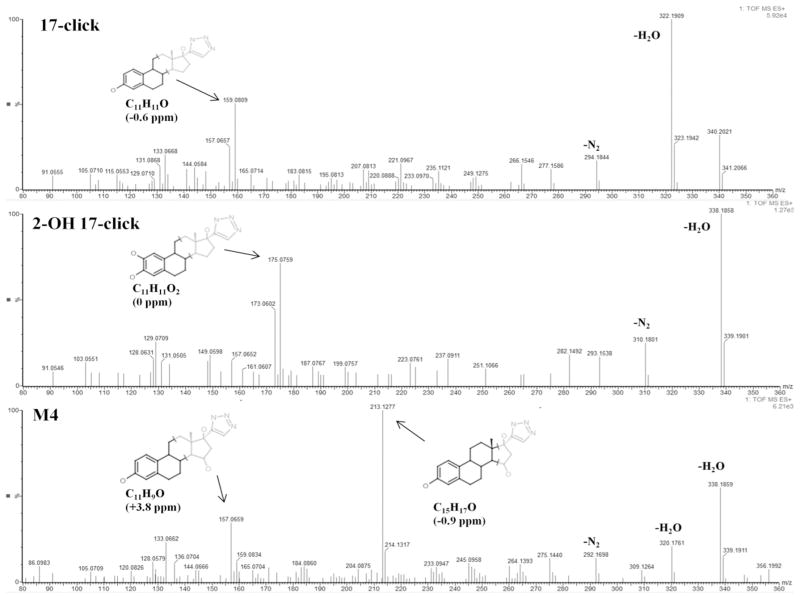
Figure 9.
MSE fragment ion spectra. 17-click (m/z = 340.2025 (C20H26N3O2)) (Top), 2-OH 17-click (Middle), and metabolite M4 (m/z = 356.1974 (C20H26N3O3)) (Bottom). M4 represents the most abundant metabolite species and closest in retention time to the synthesized 2-OH and 4-OH 17-click. High resolution mass spectra were acquired using a SYNAPT qTOF mass spectrometer in MSE mode with a collision energy ramp of 15–45V (Materials and Methods). Structural proposals for highlighted fragments were obtained using MassFragment in MassLynx MS analysis software. Note: the illustrated D-ring location of CYP3A4-mediated oxidation for M4 is indefinite, and merely represents one of few probable turnover positions near/on the steroid D-ring based on results from ion trapping (vide infra).

