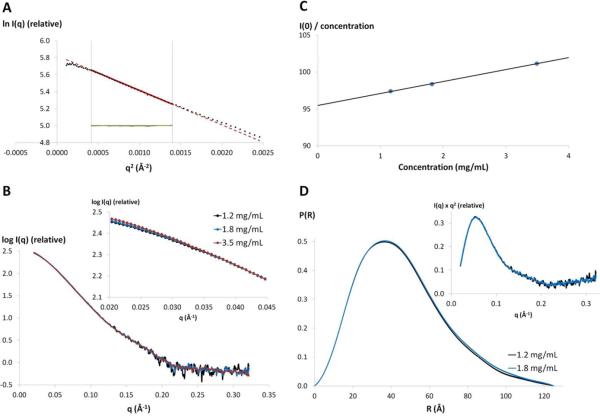
Figure 2. SAXS data analysis.
A) Guinier plot of the scattered intensities of NS51-878 at 1.2 mg/mL (black dots). The Guinier region (qRG<1.3) is delimited by the gray vertical lines. The red solid line is the linear regression fit in the Guinier region, expanded by a red broken line. The residuals are shown in green. B) Experimental scattering patterns for three concentrations of NS51-878 scaled to concentration. The concentration dependence of the scattering curves at very low scattering angles is shown in the inset. C) Concentration dependence of I(0)/Concentration, where I(0) is the forward scattering intensity derived using the Guinier law. D) Pair-distance distribution function P(R) of NS51-878 at 1.2 and 1.8 mg/mL. Kratky plots of NS51-878 SAXS data at 1.2 and 1.8 mg/mL are shown in the inset.

