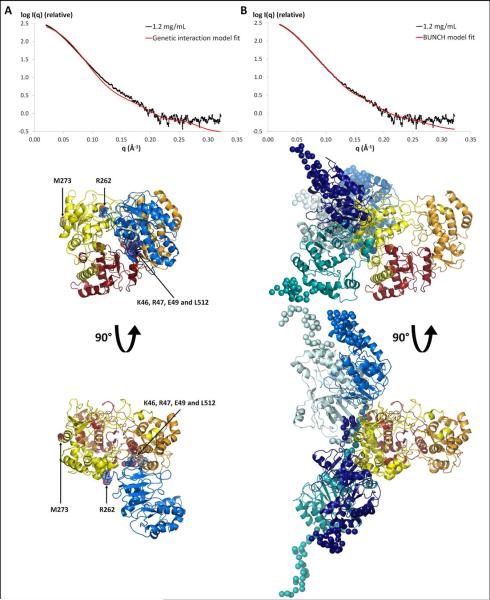
Figure 4. Comparison of the NS51-878 models with SAXS data.
A) Fit of the SAXS profile derived from the “genetic interaction” restrained rigid-body model (red curve, χ2=6.0) to the experimental scattering curve of NS51-878 at 1.2 mg/mL (black). Two views of the atomic model are also shown (same color code as in Figure 1). B) Fit of the scattering profile of the BUNCH model with the best χ2 (red curve, χ2=2.0) to the experimental scattering curve of NS51-878 at 1.2 mg/mL (black curve) is shown. Four models out of ten generated by the program BUNCH are superimposed. These four models were selected to highlight the variety of conformations obtained. The RdRp domains are colored as in Figure 1, and the GTase/MTase domains are colored in different shades of blue. The flexible regions are represented by spheres.

