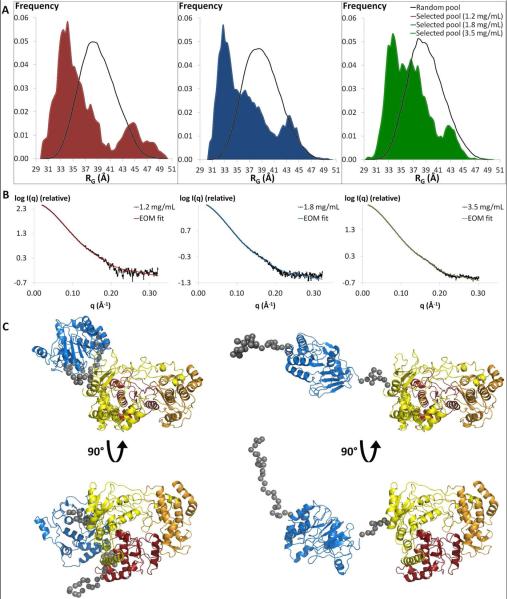
Figure 5. Multiple conformations of NS51-878.
A) Distributions of radius of gyration values for the random (black) and selected pools (colored area) of NS51-878 structures for each concentration (red: 1.2 mg/mL; blue: 1.8 mg/mL; green: 3.5 mg/mL). B) Fit of the scattering profile derived from the selected ensemble of conformations to the experimental scattering curve of NS51-878 at 1.2 mg/mL (red, χ2=1.5), 1.8 mg/mL (blue, χ2=1.2), and 3.5 mg/mL (green, χ2=1.5). C) Front and side views of two structures in the selected pool (1.2 mg/mL sample). A “compact conformation” (left, RG = 33.9 Ǻ, Dmax = 120.3 Ǻ) and an “extended conformation” (right, RG = 44.6 Ǻ, Dmax = 163.3 Ǻ) are shown with the same color code as in Figure 1. The flexible regions are represented by gray spheres.

